XRP Price Struggle Continues: Will It Find Support?
XRP price extended losses below the $0.5120 support zone. It tested the $0.5080 zone and now attempting another recovery wave toward $0.5350. XRP is struggling to start a fresh increase above the $0.5250 resistance zone....

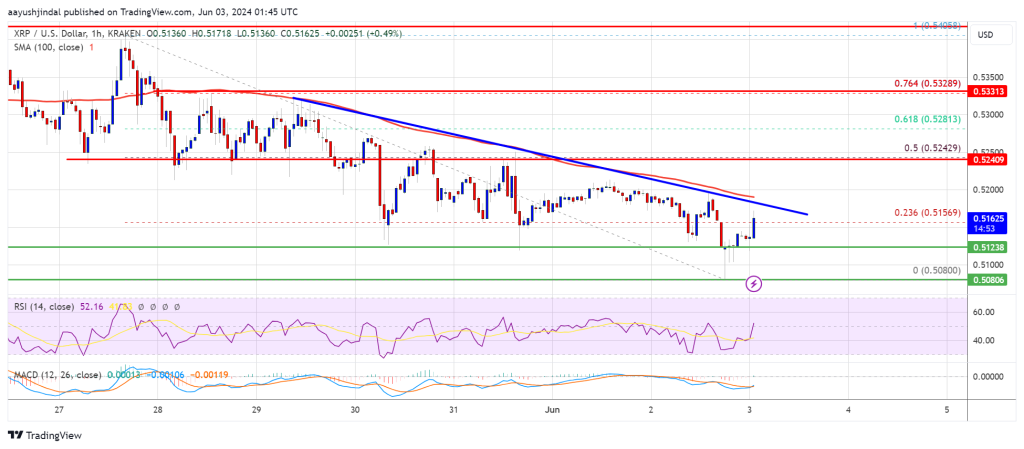
XRP price extended losses below the $0.5120 support zone. It tested the $0.5080 zone and now attempting another recovery wave toward $0.5350.
- XRP is struggling to start a fresh increase above the $0.5250 resistance zone.
- The price is now trading below $0.5150 and the 100-hourly Simple Moving Average.
- There is a key bearish trend line forming with resistance near $0.5180 on the hourly chart of the XRP/USD pair (data source from Kraken).
- The pair could continue to move down if the price stays below $0.5250.
XRP price remained in a short-term bearish zone like Bitcoin and Ethereum. The price struggled to start a recovery wave and extended losses below the $0.5220 support zone.
It even declined below the $0.5120 support. A low was formed at $0.5080 and the price is now attempting a fresh recovery wave. There was a move above the $0.5120 level. The price climbed above the 23.6% Fib retracement level of the downward wave from the $0.5405 swing high to the $0.5080 low.
However, the price is still trading below $0.520 and the 100-hourly Simple Moving Average. On the upside, the price is facing resistance near the $0.5180 level. There is also a key bearish trend line forming with resistance near $0.5180 on the hourly chart of the XRP/USD pair.
The first key resistance is near $0.5250 or the 50% Fib retracement level of the downward wave from the $0.5405 swing high to the $0.5080 low. A close above the $0.5250 resistance zone could send the price higher. The next key resistance is near $0.5320.
If there is a close above the $0.5320 resistance level, there could be a steady increase toward the $0.5450 resistance. Any more gains might send the price toward the $0.5650 resistance.
More Downsides?If XRP fails to clear the $0.5180 resistance zone, it could continue to move down. Initial support on the downside is near the $0.5120 level.
The next major support is at $0.5080. If there is a downside break and a close below the $0.5080 level, the price might accelerate lower. In the stated case, the price could decline and retest the $0.50 support in the near term.
Technical Indicators
Hourly MACD – The MACD for XRP/USD is now losing pace in the bearish zone.
Hourly RSI (Relative Strength Index) – The RSI for XRP/USD is now below the 50 level.
Major Support Levels – $0.5120 and $0.5080.
Major Resistance Levels – $0.5180 and $0.5250.
Original source
Read on NewsBTCRelated market context

Uranium Holds Above $85 as Mining ETF Rebounds From June Sell-Off
The latest charts display that the market is divided into stable physical prices and uranium shares trying to regain momentum afte...

Standard Chartered Says Bitcoin Bottomed Near $59,000 As Crypto Winter Ends
TL;DR Standard Chartered’s Geoffrey Kendrick reportedly says Bitcoin’s $59,000 area marked the cycle bottom. The note cites SpaceX...

Bitcoin rises above $64,000 after Pakistan prime minister says Iran peace deal is near
Bitcoin traded above $64,000 on Saturday, supported by its strongest ETF inflows in a month and growing optimism around geopolitic...

Are 24/7 CME Bitcoin futures a volatility cure — or a new leverage trap?
Wall Street got to trade Bitcoin around the clock just in time to watch the market fall apart. CME Group launched 24/7 trading for...

US forces shoot down Iranian attack drones near Strait of Hormuz, Bitcoin drops below $73K
Geopolitical tensions near vital oil routes can destabilize financial markets, highlighting the interconnectedness of global secur...

XRP aims for $0.90 as ETF demand battles selling pressure from whales
XRP is trading at $1.11, down roughly 17% from its June opening, having set a new 2026 low on June 5 and shed $8 billion in market...