XRP Price Struggles: Can It Break Free from the Downtrend?
XRP price extended losses below the $0.5650 support. The price is showing bearish signs and might even decline below the $0.540 level. XRP price started a fresh decline below the $0.600 zone. The price is now trading bel...

XRP price extended losses below the $0.5650 support. The price is showing bearish signs and might even decline below the $0.540 level.
- XRP price started a fresh decline below the $0.600 zone.
- The price is now trading below $0.5650 and the 100-hourly Simple Moving Average.
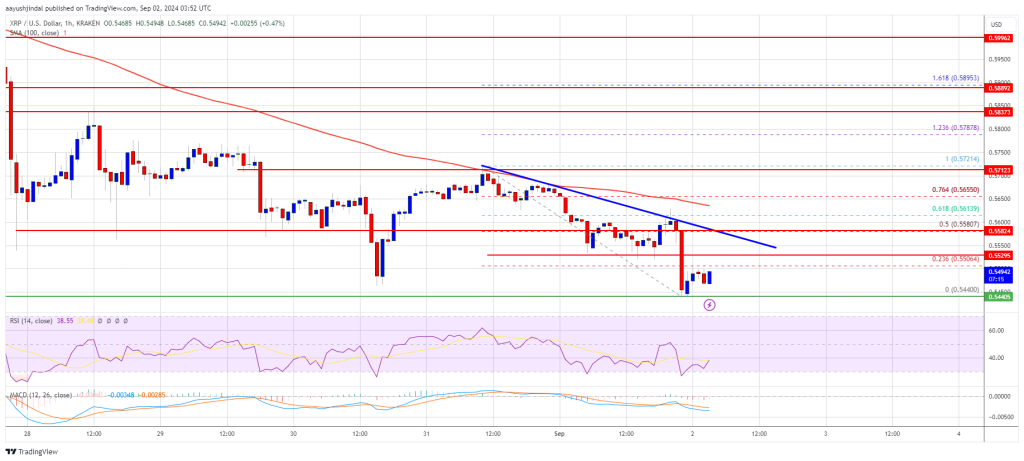
- There is a connecting bearish trend line forming with resistance at $0.5560 on the hourly chart of the XRP/USD pair (data source from Kraken).
- The pair could attempt a recovery wave if it clears the $0.5650 resistance zone.
XRP price failed to stay above the $0.60 support and extended losses like Bitcoin and Ethereum. The price declined below the $0.5650 and $0.5550 support levels to enter a bearish zone.
The price even tested the $0.5440 level. A low was formed at $0.5440 and the price is now consolidating losses. It is trying to start a recovery wave and test the 23.6% Fib retracement level of the recent decline from the $0.5721 swing high to the $0.5440 low.
The price is still trading below $0.5650 and the 100-hourly Simple Moving Average. On the upside, the price might face resistance near the $0.5550 level. The first major resistance is near the $0.5560 level. There is also a connecting bearish trend line forming with resistance at $0.5560 on the hourly chart of the XRP/USD pair.
The trend line is close to the 50% Fib retracement level of the recent decline from the $0.5721 swing high to the $0.5440 low. The next key resistance could be $0.5650. A clear move above the $0.5650 resistance might send the price toward the $0.5720 resistance.
The next major resistance is near the $0.5840 level. Any more gains might send the price toward the $0.5920 resistance or even $0.60 in the near term.
More Losses?If XRP fails to clear the $0.5650 resistance zone, it could start another decline. Initial support on the downside is near the $0.5440 level. The next major support is at $0.5320.
If there is a downside break and a close below the $0.5320 level, the price might continue to decline toward the $0.5220 support in the near term. The next major support sits at $0.5150.
Technical Indicators
Hourly MACD – The MACD for XRP/USD is now gaining pace in the bearish zone.
Hourly RSI (Relative Strength Index) – The RSI for XRP/USD is now below the 50 level.
Major Support Levels – $0.5440 and $0.5320.
Major Resistance Levels – $0.5560 and $0.5650.
Original source
Read on NewsBTCRelated market context

US forces shoot down Iranian attack drones near Strait of Hormuz, Bitcoin drops below $73K
Geopolitical tensions near vital oil routes can destabilize financial markets, highlighting the interconnectedness of global secur...

Bitcoin price challenges $64,000 weekend wall – needing a breakout or risk a deeper correction
Bitcoin reclaimed $64,000 on June 12 and touched an intraday high of $64,301 in the same session that spot ETF flows finally flipp...

Standard Chartered Says Bitcoin Bottomed Near $59,000 As Crypto Winter Ends
TL;DR Standard Chartered’s Geoffrey Kendrick reportedly says Bitcoin’s $59,000 area marked the cycle bottom. The note cites SpaceX...

XRP aims for $0.90 as ETF demand battles selling pressure from whales
XRP is trading at $1.11, down roughly 17% from its June opening, having set a new 2026 low on June 5 and shed $8 billion in market...

Google Gemini AI Predicts Jaw-Dropping XRP Price For Next 90 Days
Google Gemini AI just put XRP back under the spotlight, predicting it is tightly wound for a major breakout toward $1.60 to $1.80...

Bitcoin Mining Cost Model Points To $47,000 Floor, But Analysts Urge Caution
TL;DR Crypto Rover says Bitcoin has never bottomed below electrical production cost, currently estimated at $47,000. Mining-cost m...