XRP Price Stuck in a Range: Will It Break Out Soon?
XRP price again struggled to continue higher above the $0.540 resistance. It is now consolidating near $0.5320 and might aim for an upside break. XRP is still facing many hurdles near the $0.5420 zone. The price is now t...
Archive context
Older archive item. Useful for background and entity history, but not a fresh market-moving signal.

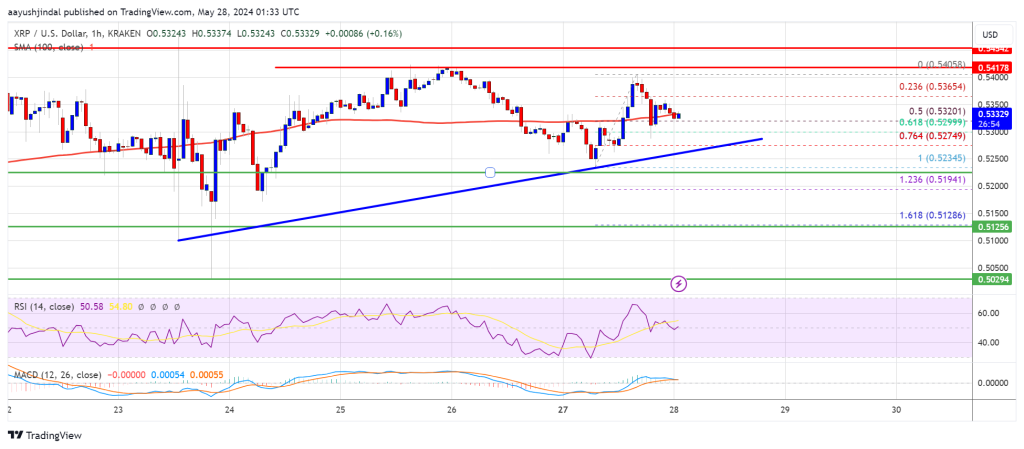
XRP price again struggled to continue higher above the $0.540 resistance. It is now consolidating near $0.5320 and might aim for an upside break.
- XRP is still facing many hurdles near the $0.5420 zone.
- The price is now trading near $0.5320 and the 100-hourly Simple Moving Average.
- There is a connecting bullish trend line forming with support near $0.5265 on the hourly chart of the XRP/USD pair (data source from Kraken).
- The pair could start a fresh increase if the bulls remain active above the $0.5220 zone.
In the past few sessions, XRP price traded in a positive zone like Bitcoin and Ethereum. However, the bears were active near the $0.540 and $0.5420 resistance levels.
The recent high was formed at $0.5405 and the price is now correcting gains in a range. There was a move below the $0.5340 support zone and the price spiked below the 50% Fib retracement level of the upward move from the $0.5234 swing low to the $0.5405 high.
However, the bulls are active near the $0.530 zone and the 61.8% Fib retracement level of the upward move from the $0.5234 swing low to the $0.5405 high. There is also a connecting bullish trend line forming with support near $0.5265 on the hourly chart of the XRP/USD pair.
The pair is now trading near $0.5320 and the 100-hourly Simple Moving Average. Immediate resistance is near the $0.5365 level. The first key resistance is near $0.5420. A close above the $0.5420 resistance zone could send the price higher. The next key resistance is near $0.5450.
If there is a close above the $0.5450 resistance level, there could be a steady increase toward the $0.5550 resistance. Any more gains might send the price toward the $0.5720 resistance.
More Downsides?If XRP fails to clear the $0.5420 resistance zone, it could continue to move down. Initial support on the downside is near the $0.5265 level and the trend line.
The next major support is at $0.520. If there is a downside break and a close below the $0.520 level, the price might gain bearish momentum. In the stated case, the price could decline and retest the $0.5120 support in the near term.
Technical Indicators
Hourly MACD – The MACD for XRP/USD is now losing pace in the bullish zone.
Hourly RSI (Relative Strength Index) – The RSI for XRP/USD is now above the 50 level.
Major Support Levels – $0.5300 and $0.5200.
Major Resistance Levels – $0.5365 and $0.5420.
Why this matters
This altcoin story adds another data point to the current market tape and is useful when read alongside nearby source coverage.
Original source
Read on NewsBTCRelated market context

Leading Claude AI Fable 5 Predicts Stunning XRP Price by The End of 2026
Anthropic’s new Claude AI model, Fable 5, predicts XRP price for the entire second half around a single event that could be resolv...

Mark Zuckerberg’s Meta AI Predicts Unbelievable Bitcoin Price by the End of 2026
Mark Zuckerberg’s Meta AI predicts and stacks 4 numbered catalysts behind its Bitcoin price prediction that puts $120,000 to $150,...

Bitcoin whales send 49,000 BTC to exchanges as $60K rebound shows signs of weakness
Bitcoin’s recovery above $60,000 is facing a fresh test from exchange-flow and derivatives data after large holders moved one of t...

Bitcoin Price Eyes Recovery After END-OF-CYCLE STRC Shock, Bitwise CIO Says Strategy Will Be ‘Less Important’ Next BTC Cycle
While improving macroeconomic conditions have supported a modest Bitcoin price rebound, Bitwise Chief Investment Officer Matt Houg...
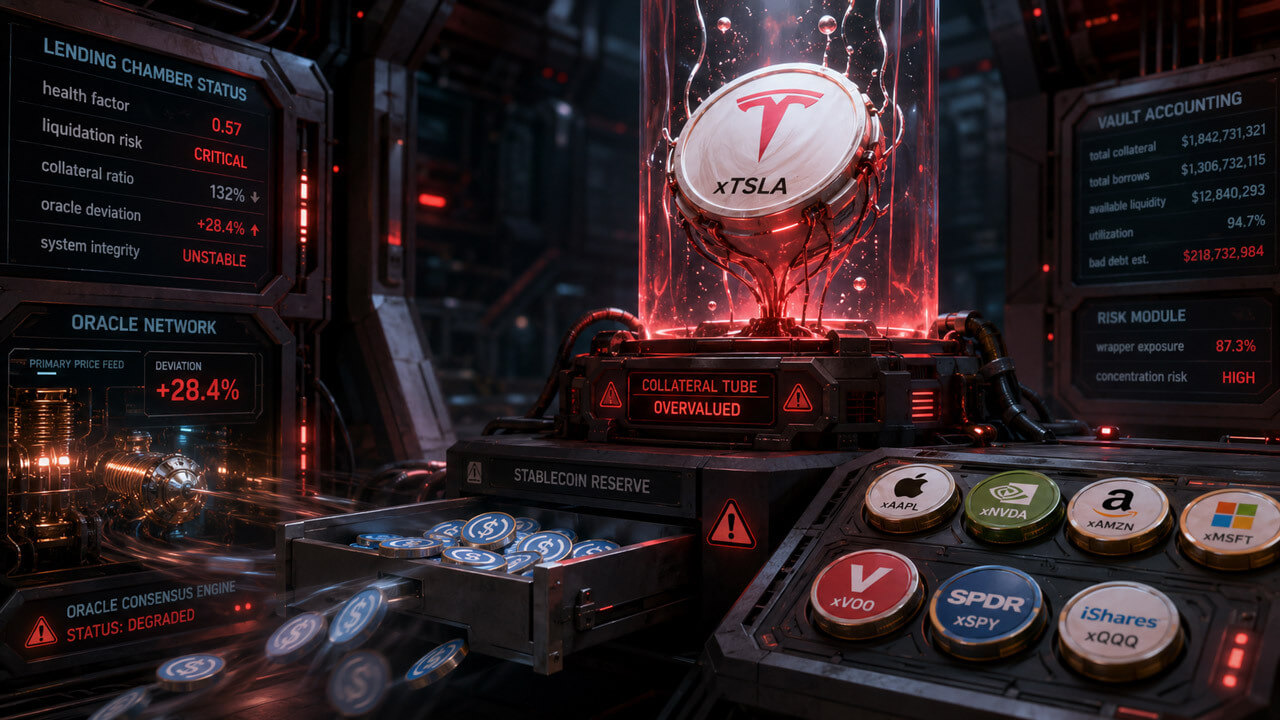
How tokenized stocks fail as collateral even when the stock price does not move
DeFi lending protocol Edel disclosed a $403,000 exploit that hit the layer where tokenized stocks are trying to become DeFi collat...

Ethlabs Launches with Five Former Ethereum Foundation Researchers to Speed Up Settlement
This is not just another ticker-level move. It points to a deeper shift in how capital, infrastructure, or regulation is moving th...