XRP Price Stuck In A Tight Cage—Breakout Pressure Keeps Building
XRP price started a recovery wave above $1.3620 and $1.3650. The price is now consolidating and might aim for a fresh move if it clears $1.3840. XRP price started a recovery wave above the $1.3640 zone. The price is now...
Archive context
Older archive item. Useful for background and entity history, but not a fresh market-moving signal.

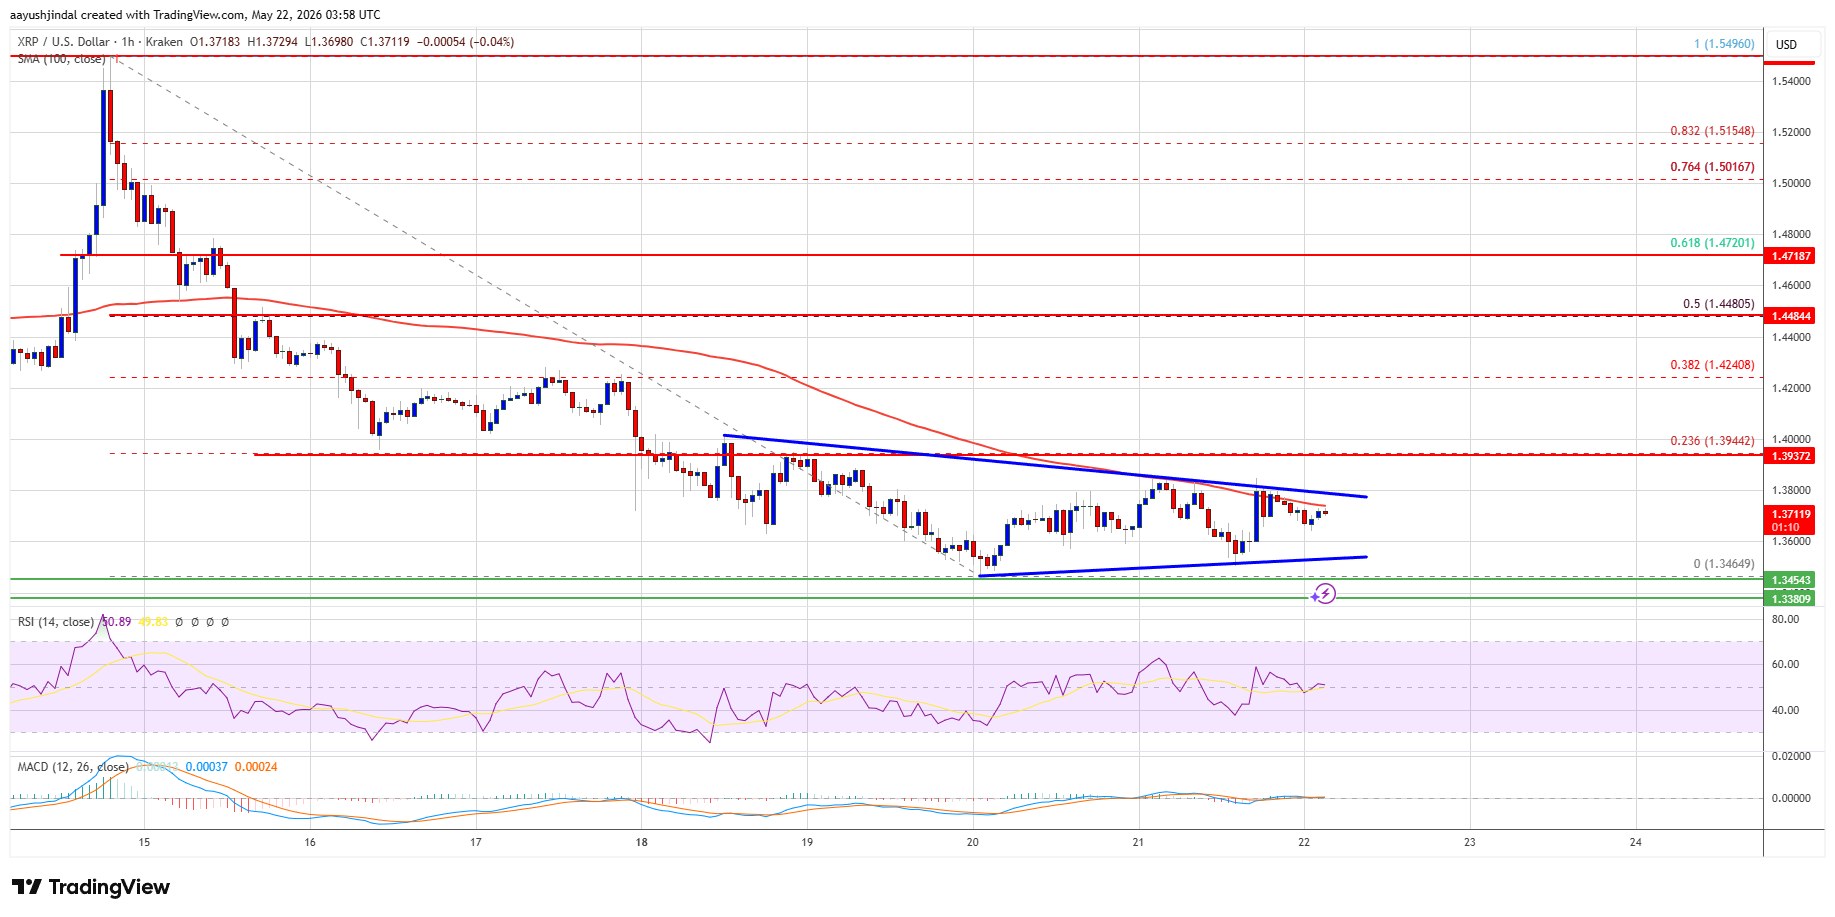
XRP price started a recovery wave above $1.3620 and $1.3650. The price is now consolidating and might aim for a fresh move if it clears $1.3840.
- XRP price started a recovery wave above the $1.3640 zone.
- The price is now trading below $1.3820 and the 100-hourly Simple Moving Average.
- There is a contracting triangle forming with resistance at $1.380 on the hourly chart of the XRP/USD pair (data source from Kraken).
- The pair could continue to move up if it settles above $1.3840.
XRP price remained supported above $1.350 and started a recovery wave, like Bitcoin and Ethereum. The price was able to climb above $1.3580 and $1.3620 to enter a short-term positive zone.
However, the price is still below $1.3850 and the 23.6% Fib retracement level of the downward move from the $1.5495 swing high to the $1.3465 swing low. There is also a contracting triangle forming with resistance at $1.380 on the hourly chart of the XRP/USD pair.
The price is now trading below $1.3750 and the 100-hourly Simple Moving Average. If there is a fresh upward move, the price might face resistance near the $1.3780 level. The first major resistance is near the $1.380 level.
A close above $1.380 could send the price to $1.3840. The next hurdle sits at $1.3940. A clear move above the $1.3940 resistance might send the price toward the $1.420 resistance. Any more gains might send the price toward the $1.4480 resistance or the 50% Fib retracement level of the downward move from the $1.5495 swing high to the $1.3465 swing low.
Another Decline?If XRP fails to clear the $1.3840 resistance zone, it could start a fresh decline. Initial support on the downside is near the $1.360 level. The next major support is near the $1.3580 level.
If there is a downside break and a close below the $1.3580 level, the price might continue to decline toward $1.340. The next major support sits near the $1.3380 zone, below which the price could continue lower toward $1.3250.
Technical Indicators
Hourly MACD – The MACD for XRP/USD is now losing pace in the bullish zone.
Hourly RSI (Relative Strength Index) – The RSI for XRP/USD is now above the 50 level.
Major Support Levels – $1.3600 and $1.3580.
Major Resistance Levels – $1.3840 and $1.3940.
Why this matters
XRP is a tracked market entity in the DigitalMoneyBox archive, making this useful context for readers monitoring repeated mentions and follow-up coverage.
Original source
Read on NewsBTCRelated market context

Ethereum (ETH) Price Prediction: $2,000 or $1,680 Next as ETH Reaches a Critical Turning Point
Ethereum price has fallen back below $1,900 after buyers failed to maintain the latest recovery, leaving ETH positioned between an...

Ethereum Price Prediction: Blackrock Backed Stablecoin to Launch on ETH
Ethereum price is trading near $1,900, but the market may be underestimating a major institutional development that could boost it...

Bitcoin And Ethereum Edge Higher As Traders Watch Altcoin Rotation
Bitcoin and Ethereum edged higher into July 31, while a small shift in market dominance suggested traders were again watching whet...

Bitcoin (BTC) Price Today: Michael Saylor’s Strategy Reports $8.3B Loss as BTC Slides Below $64K
The BTC move comes shortly after Strategy reported an $8.33 billion operating loss for the second quarter of 2026, including an $8...

Bitcoin ETFs just bled $265M in a brutal 24 hours, and Ethereum’s supposed rescue is another BlackRock illusion
U.S. spot Bitcoin funds posted net outflows of $265.4 million on July 31, reversing a $233.1 million inflow the previous session....

If Bitcoin breaks $62k over the weekend, a $1.1B short overhang stands ready to pull price down to $60k
Bitcoin enters the weekend near $62,900, less than 1% above the July 31 intraday low, and Deribit has already settled roughly $9.6...