XRP Price Stuck In Range As Bulls Struggle To Clear Key Resistance
XRP price started a recovery wave from $2.320. The price is now struggling to clear $2.420 and might decline if it trades below the $2.350 support. XRP price is attempting to recover above the $2.350 zone. The price is n...

XRP price started a recovery wave from $2.320. The price is now struggling to clear $2.420 and might decline if it trades below the $2.350 support.
- XRP price is attempting to recover above the $2.350 zone.
- The price is now trading above $2.350 and the 100-hourly Simple Moving Average.
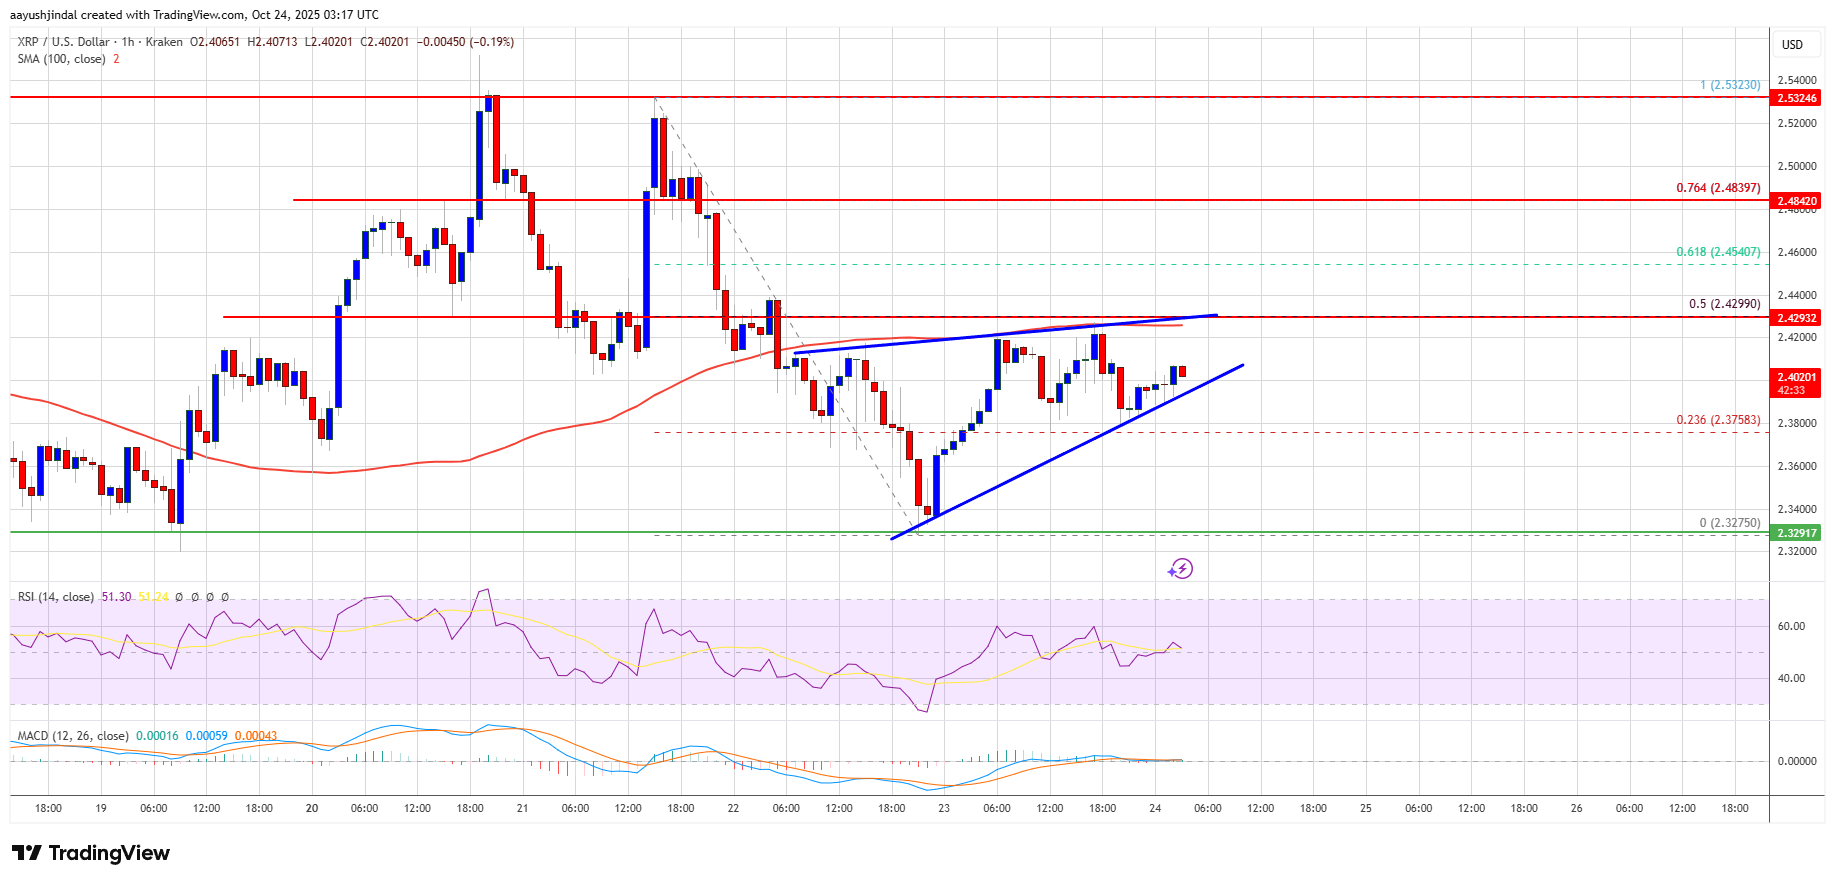
- There is a contracting triangle forming with resistance at $2.420 on the hourly chart of the XRP/USD pair (data source from Kraken).
- The pair could start a fresh increase if it clears the $2.420 resistance.
XRP price formed a base above $2.30 and started a fresh increase, like Bitcoin and Ethereum. The price surpassed the $2.3750 and $2.380 resistance levels.
The bulls were able to push the price above the 23.6% Fib retracement level of the downward move from the $2.5320 swing high to the $2.3275 low. However, the bears are currently active near the $2.420 zone and the 100-hourly Simple Moving Average.
The price is now trading below $2.420 and the 100-hourly Simple Moving Average. There is a contracting triangle forming with resistance at $2.420 on the hourly chart of the XRP/USD pair.
If there is a fresh upward move, the price might face resistance near the $2.420 level. It is also close to the 50% Fib retracement level of the downward move from the $2.5320 swing high to the $2.3275 low. The first major resistance is near the $2.480 level, above which the price could rise and test $2.550.
A clear move above the $2.550 resistance might send the price toward the $2.580 resistance. Any more gains might send the price toward the $2.650 resistance. The next major hurdle for the bulls might be near $2.720.
Another Drop?If XRP fails to clear the $2.420 resistance zone, it could start a fresh decline. Initial support on the downside is near the $2.380 level. The next major support is near the $2.350 level.
If there is a downside break and a close below the $2.350 level, the price might continue to decline toward $2.320. The next major support sits near the $2.250 zone, below which the price could continue lower toward $2.20.
Technical Indicators
Hourly MACD – The MACD for XRP/USD is now gaining pace in the bullish zone.
Hourly RSI (Relative Strength Index) – The RSI for XRP/USD is now above the 50 level.
Major Support Levels – $2.350 and $2.320.
Major Resistance Levels – $2.420 and $2.50.
Original source
Read on NewsBTCRelated market context

Bitcoin (BTC) Price Prediction: BTC Eyes $70K Liquidity Sweep as Whales Reclaim Control Near $62K
Market data suggests that long-term holders remain largely inactive, while whale activity is beginning to recover, creating an int...

Ethereum Nears 200 Million Non-Empty Wallets Despite Market Uncertainty
Despite persistent market uncertainty and bearish sentiment across parts of the cryptocurrency sector, Ethereum is approaching a s...

XRP Price Prediction: Japan XRP ETF Listing is Getting Closer
Japan just handed XRP bulls a major regulatory tailwind. XRP price is retesting a congestion zone, and the prediction could turn b...

Ethereum Price Prediction: 3 Million ETH Rushes Into Staking as Sellers Vanish
Is nobody leaving Ethereum? A record 36 million ETH is now locked in staking, roughly 29–30% of the circulating supply, and the va...

Most Traders Will Scroll Past This Grok AI Bitcoin Predicts, Big Mistake
Elon Musk Grok AI just looked at a Bitcoin chart down more than 50% and predicts it’s a classic accumulation zone, targeting $150,...

XRP Price Prediction: Japan Regulates Crypto like Stocks, XRP to Benefit First
Japan just rewrote the rules. XRP price is battling below resistance at $1.10, but it’s prediction is getting bullish as Japan’s p...