XRP Price Targets Strong Recovery: Key Indicators and Predictions
XRP price extended losses and tested the $0.4620 support. The price is now recovering and might gain bullish momentum if it clears the $0.4825 resistance. XRP price remained in a bearish zone and tested the $0.4620 suppo...

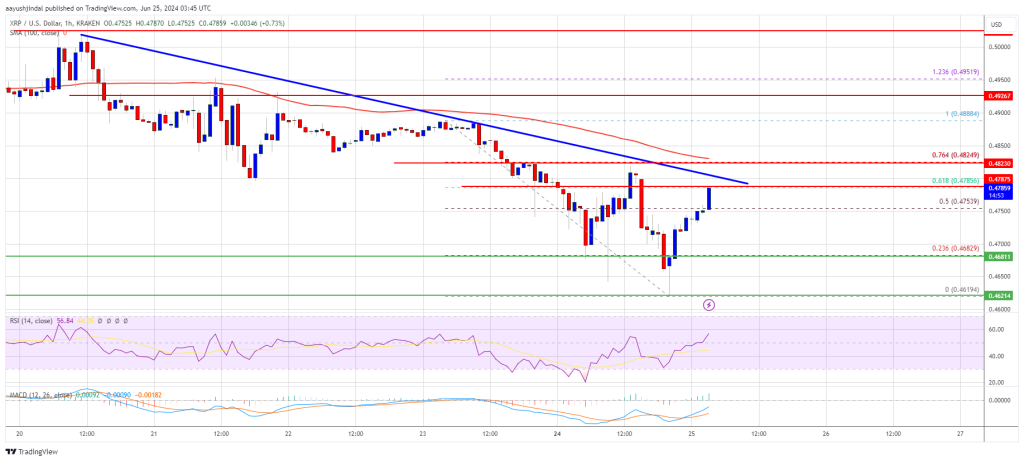
XRP price extended losses and tested the $0.4620 support. The price is now recovering and might gain bullish momentum if it clears the $0.4825 resistance.
- XRP price remained in a bearish zone and tested the $0.4620 support zone.
- The price is now trading below $0.4820 and the 100-hourly Simple Moving Average.
- There is a key bearish trend line forming with resistance at $0.4785 on the hourly chart of the XRP/USD pair (data source from Kraken).
- The pair could recover steadily if there is a move above $0.4800 and $0.4820.
XRP price failed to clear the $0.4820 resistance zone and started another decline like Bitcoin and Ethereum. There was a move below the $0.480 and $0.4750 levels. The price even spiked below $0.4650.
However, the bulls were active near $0.4620. A low was formed at $0.4619 and the price is now recovering losses. There was an upward move above the $0.4680 and $0.4720 resistance levels. The price cleared the 50% Fib retracement level of the downward move from the $0.4885 swing high to the $0.4619 low.
It is now trading below $0.4850 and the 100-hourly Simple Moving Average. On the upside, the price is facing resistance near the $0.4780 level. There is also a key bearish trend line forming with resistance at $0.4785 on the hourly chart of the XRP/USD pair.
The trend line is close to the 61.8% Fib retracement level of the downward move from the $0.4885 swing high to the $0.4619 low. The first major resistance is near the $0.4825 level.
A clear move above the $0.4825 resistance might send the price toward the $0.4880 resistance. The next major resistance is near the $0.500 level. A close above the $0.500 resistance zone could send the price higher. The next key resistance is near $0.5250. Any more gains might send the price toward the $0.5500 resistance.
Another Decline?If XRP fails to clear the $0.4825 resistance zone, it could start another decline. Initial support on the downside is near the $0.4680 level.
The next major support is at $0.4620. If there is a downside break and a close below the $0.4620 level, the price might decline further. In the stated case, the price could even trade below the $0.450 support in the near term.
Technical Indicators
Hourly MACD – The MACD for XRP/USD is now gaining pace in the bullish zone.
Hourly RSI (Relative Strength Index) – The RSI for XRP/USD is now above the 50 level.
Major Support Levels – $0.4680 and $0.4620.
Major Resistance Levels – $0.4800 and $0.4825.
Original source
Read on NewsBTCRelated market context

Uranium Holds Above $85 as Mining ETF Rebounds From June Sell-Off
The latest charts display that the market is divided into stable physical prices and uranium shares trying to regain momentum afte...

Standard Chartered Says Bitcoin Bottomed Near $59,000 As Crypto Winter Ends
TL;DR Standard Chartered’s Geoffrey Kendrick reportedly says Bitcoin’s $59,000 area marked the cycle bottom. The note cites SpaceX...

Bitcoin price challenges $64,000 weekend wall – needing a breakout or risk a deeper correction
Bitcoin reclaimed $64,000 on June 12 and touched an intraday high of $64,301 in the same session that spot ETF flows finally flipp...

Google Gemini AI Predicts Jaw-Dropping XRP Price For Next 90 Days
Google Gemini AI just put XRP back under the spotlight, predicting it is tightly wound for a major breakout toward $1.60 to $1.80...

Elon Musk SpaceX AI Predicts Incredible Bitcoin Price For Next 30 Days
Here is the thing about capitulation calls. They only sound smart in hindsight. Right now, with Bitcoin price scraping along the l...

Bitcoin Mining Cost Model Points To $47,000 Floor, But Analysts Urge Caution
TL;DR Crypto Rover says Bitcoin has never bottomed below electrical production cost, currently estimated at $47,000. Mining-cost m...