XRP Price Today: XRP Hits $1.60 as Heavy Whale Accumulation Points to a $2 Rally and Beyond
The XRP price reached $1.6060 on September 23 after opening near $1.5808, according to historical market data. The token subsequently pulled back toward $1.50 on September 22, leaving the $1.50 level as an important shor...
Archive context
Older archive item. Useful for background and entity history, but not a fresh market-moving signal.

The XRP price reached $1.6060 on September 23 after opening near $1.5808, according to historical market data. The token subsequently pulled back toward $1.50 on September 22, leaving the $1.50 level as an important short-term reference.
XRP Price Reclaims $1.60The latest move extends a recovery that began after the price fell toward the $1.25-$1.30 region earlier in September. On September 18, XRP gained 7.69% before advancing another 8.90% on September 21. The price has therefore moved sharply higher over a relatively short period, although the September 22 session showed some cooling after the previous day’s surge.
XRP’s daily outlook remains bullish near the $1.53 resistance after a positive candle close, with the next entry planned above that level. Source: @cryptoWZRD_ via X
For the current XRP price, the immediate technical focus is around $1.53. Crypto trader @cryptoWZRD_ highlighted a positive daily close and identified $1.53 as a resistance level to watch for a potential continuation. The analysis also pointed to the broader cryptocurrency market, particularly Bitcoin, as an important driver of XRP’s recent move.
The structure is also being watched around the $1.50-$1.60 range. A sustained move above this area would place the next resistance levels further up, while a rejection could leave the token vulnerable to a retracement toward its recent support zones.
Whales Add 1.54 Billion XRPOn-chain activity has added another dimension to the recent price rally. Data cited by Ali Charts from Santiment indicates that large XRP holders accumulated approximately 1.54 billion tokens over 96 hours. At the prices used in the analysis, the holdings were valued at roughly $2.2 billion.
Whales accumulated 1.54 billion XRP, worth approximately $2.2 billion, over 96 hours, preceding an 8.22% rally over three days. Source: Ali Martinez via X
The tracked whale holdings rose from roughly 8.1 billion XRP to around 9.7 billion during the accumulation period. The increase coincided with an 8.22% rise in XRP over three days, according to reports citing the same data.
However, wallet accumulation should not be treated as a direct forecast of future prices. The data shows that the tracked large-holder cohort increased its XRP balance, but it does not establish why those wallets accumulated the tokens or whether the holdings will remain unchanged.
That distinction is important for evaluating the XRP coin price. Large-wallet movements can affect available liquidity, but their effect on price depends on subsequent buying, selling, and transfers across the market.
$1.60 Becomes the Key ResistanceGlassnode’s UTXO Realized Price Distribution data has placed additional attention on $1.60. The distribution shows a substantial amount of XRP has previously traded around that level, making it a potential area where existing holders could reassess their positions.
Reports citing the data identify roughly 2.5 billion tokens around the $1.60 region. That creates a notable supply cluster immediately above the current market. If the price moves into this area, the response could provide a clearer indication of whether the recent recovery has enough demand to continue higher.
The technical picture also shows a series of lower support zones. The $1.36-$1.39 region has acted as an important pivot area, while deeper demand has been identified around $1.27-$1.30 and $1.24-$1.26.
Technical Indicators Remain ConstructiveThe broader XRP chart has also improved following the September rebound. TipRanks’ technical data shows longer-term moving averages positioned below the market across several periods, while the MACD remained positive in its latest available reading.
The same dataset showed a 200-day simple moving average near $1.27 and a 50-day simple moving average around $1.23 in its September 17 snapshot. These levels provide useful reference points because the token is now trading considerably above those longer-term averages.
Momentum indicators, however, do not provide a uniformly bullish signal. RSI can remain neutral even during a rising market, while faster oscillators can become stretched after a sharp rally. This means the recent advance does not eliminate the possibility of short-term consolidation or a pullback.
That distinction matters when assessing an XRP price prediction today. Moving averages can describe the prevailing trend, but they do not determine where the market will trade next.
$2 Target Depends on a BreakoutSome technical analysts are looking considerably higher. ChartNerdTA has discussed a longer-term XRP structure involving multi-year consolidation patterns, Fibonacci extensions, and the 50-week exponential moving average. Earlier analysis from the account identified the $1.52 area as an important resistance zone and the $1.29 region as a key support level.
The analyst highlights constructive long-term XRP chart alignment despite resistance at the 50-week EMA, identifying 2026 as a key convergence year before a potential move toward $8. Source: @ChartNerdTA via X
Other technical analyses have placed the $2 level on the radar if the price can establish a sustained move above the $1.50-$1.60 supply region. The level is therefore better viewed as a chart-based scenario rather than a confirmed XRP price target.
For that scenario to gain technical confirmation, the token would need to maintain acceptance above the current resistance cluster rather than simply trade briefly through it. A failure around $1.53-$1.60 could instead send the XRP price back toward lower support.
The broader market will also remain relevant. Recent analysis has noted Bitcoin’s influence on XRP’s recovery, meaning a change in overall crypto-market momentum could affect whether the price maintains its breakout attempt.
XRP Price Levels to WatchFor the near term, $1.50 is now an important psychological and technical reference after XRP moved back above it. The next resistance area sits around $1.55-$1.61, followed by the $1.60 supply cluster identified through on-chain distribution data.
Above $1.60, the market would need to establish additional support before a move toward $2 could be considered technically stronger. Conversely, a loss of the $1.50 area would weaken the immediate breakout structure and put greater attention on the $1.45-$1.50 zone.
Below that region, the $1.36-$1.39 area remains an important pivot, followed by $1.27-$1.30. These levels provide a framework for assessing whether the recent recovery is developing into a broader trend or returning to consolidation.
For those tracking XRP news today, the combination of whale accumulation, elevated leverage, and improving price structure makes the $1.53-$1.60 range particularly significant. The next sustained move through or away from that zone should provide more information about whether the XRP price can extend the current recovery toward the $2 area.
Why this matters
XRP is a tracked market entity in the DigitalMoneyBox archive, making this useful context for readers monitoring repeated mentions and follow-up coverage.
Original source
Read on Brave New CoinRelated market context

Hot Inflation Data Puts Bitcoin Under Pressure, but ‘Difficult’ Isn’t ‘Bearish’: CoinShares
Bitcoin Magazine Hot Inflation Data Puts Bitcoin Under Pressure, but ‘Difficult’ Isn’t ‘Bearish’: CoinShares Bitcoin’s price has d...

XRP Price Could Surge 145% as 2023 Rally Pattern Returns
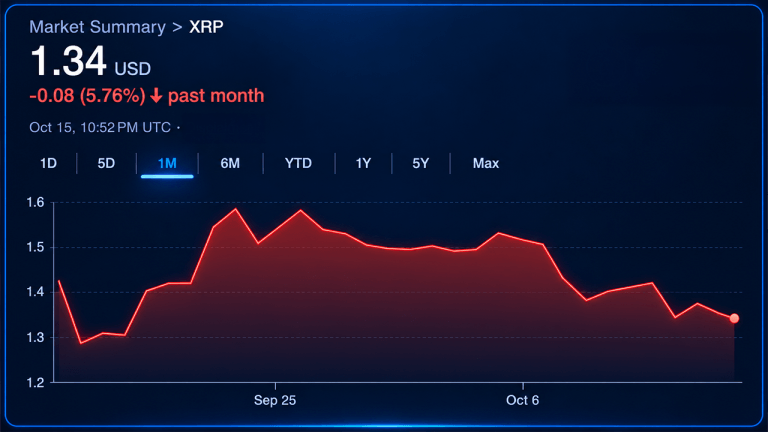
XRP price traded near $1.34 on October 16, about 4% below the 200-day simple moving average (SMA) at $1.36. The immediate test is...
XRP Whales Move 1.67 Billion Tokens to Binance as Price Slips
Large XRP holders have transferred 1.669 billion XRP to Binance over the past 30 days, pushing the exchange’s whale inflow metric...

Google Gemini AI Predicts Bitcoin to Hit $175K by 2027
When prompted, Google Gemini AI predicts that by January 1, 2027, Bitcoin could be trading for $175,000. It gives a hypothetical c...

Ethereum Price Prediction: ETH Outpaces the Market as Crypto Rebounds
Ethereum is outperforming the crypto market, rising by almost 3% over the past 24 hours to just a notch under $2,500 as digital as...

Bitcoin Price Prediction: Bitcoin Tracks Treasury Real Rates, Fidelity Finds
Bitcoin is trading at $82,000, rebounding from $80,000 since yesterday morning, as traders weigh a new macro signal that could fli...