XRP Price Trapped in a Tight Range: Will It Break Free?
ItXRP price remained in a tight range below the $0.60 barrier. The price could extend losses if there is a close below the $0.5550 support zone. XRP price started a consolidation phase below the $0.600 zone. The price is...

ItXRP price remained in a tight range below the $0.60 barrier. The price could extend losses if there is a close below the $0.5550 support zone.
- XRP price started a consolidation phase below the $0.600 zone.
- The price is now trading below $0.5750 and the 100-hourly Simple Moving Average.
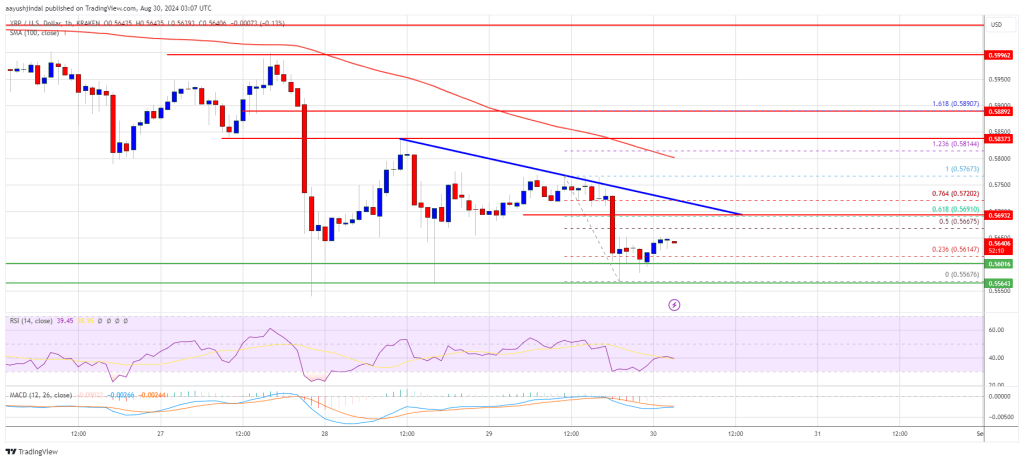
- There is a connecting bearish trend line forming with resistance at $0.570 on the hourly chart of the XRP/USD pair (data source from Kraken).
- The pair could attempt a recovery wave if it clears the $0.5750 resistance zone.
XRP price remained stable above the $0.5550 support like Bitcoin and Ethereum. The price attempted a recovery wave, but it was short-lived. It climbed above the $0.5650 level and tested $0.5750 before there was another decline.
The price retested the $0.5550 support. A low was formed at $0.5567 and the price is now consolidating losses. It managed to rise above the 23.6% Fib retracement level of the recent decline from the $0.5767 swing high to the $0.5567 low.
The price is still trading below $0.5750 and the 100-hourly Simple Moving Average. On the upside, the price might face resistance near the $0.5680 level. The first major resistance is near the $0.570 level. There is also a connecting bearish trend line forming with resistance at $0.570 on the hourly chart of the XRP/USD pair.
The trend line is close to the 61.8% Fib retracement level of the recent decline from the $0.5767 swing high to the $0.5567 low. The next key resistance could be $0.5750. A clear move above the $0.5750 resistance might send the price toward the $0.5850 resistance. The next major resistance is near the $0.6020 level. Any more gains might send the price toward the $0.6160 resistance or even $0.6250 in the near term.
More Losses?If XRP fails to clear the $0.570 resistance zone, it could start another decline. Initial support on the downside is near the $0.560 level. The next major support is at $0.5550.
If there is a downside break and a close below the $0.5550 level, the price might continue to decline toward the $0.5320 support in the near term. The next major support sits at $0.5120.
Technical Indicators
Hourly MACD – The MACD for XRP/USD is now losing pace in the bearish zone.
Hourly RSI (Relative Strength Index) – The RSI for XRP/USD is now below the 50 level.
Major Support Levels – $0.5600 and $0.5550.
Major Resistance Levels – $0.5700 and $0.5850.
Original source
Read on NewsBTCRelated market context

Standard Chartered Says Bitcoin Bottomed Near $59,000 As Crypto Winter Ends
TL;DR Standard Chartered’s Geoffrey Kendrick reportedly says Bitcoin’s $59,000 area marked the cycle bottom. The note cites SpaceX...

Bitcoin price challenges $64,000 weekend wall – needing a breakout or risk a deeper correction
Bitcoin reclaimed $64,000 on June 12 and touched an intraday high of $64,301 in the same session that spot ETF flows finally flipp...

Bitcoin Mining Cost Model Points To $47,000 Floor, But Analysts Urge Caution
TL;DR Crypto Rover says Bitcoin has never bottomed below electrical production cost, currently estimated at $47,000. Mining-cost m...

Bitcoin rises above $64,000 after Pakistan prime minister says Iran peace deal is near
Bitcoin traded above $64,000 on Saturday, supported by its strongest ETF inflows in a month and growing optimism around geopolitic...

US forces shoot down Iranian attack drones near Strait of Hormuz, Bitcoin drops below $73K
Geopolitical tensions near vital oil routes can destabilize financial markets, highlighting the interconnectedness of global secur...

Bitcoin price faces new risk as big buyers lose conviction
Bitcoin’s largest buyers are no longer behaving like a reliable backstop for the largest cryptocurrency. The exchange-traded funds...