XRP Price Under Pressure — Bulls Attempt To Defend Key Support Zone
XRP price started a recovery wave from $2.20. The price is struggling to clear $2.50 and might decline if it trades below the $2.320 support. XRP price is moving lower from the $2.550 zone. The price is now trading below...

XRP price started a recovery wave from $2.20. The price is struggling to clear $2.50 and might decline if it trades below the $2.320 support.
- XRP price is moving lower from the $2.550 zone.
- The price is now trading below $2.420 and the 100-hourly Simple Moving Average.
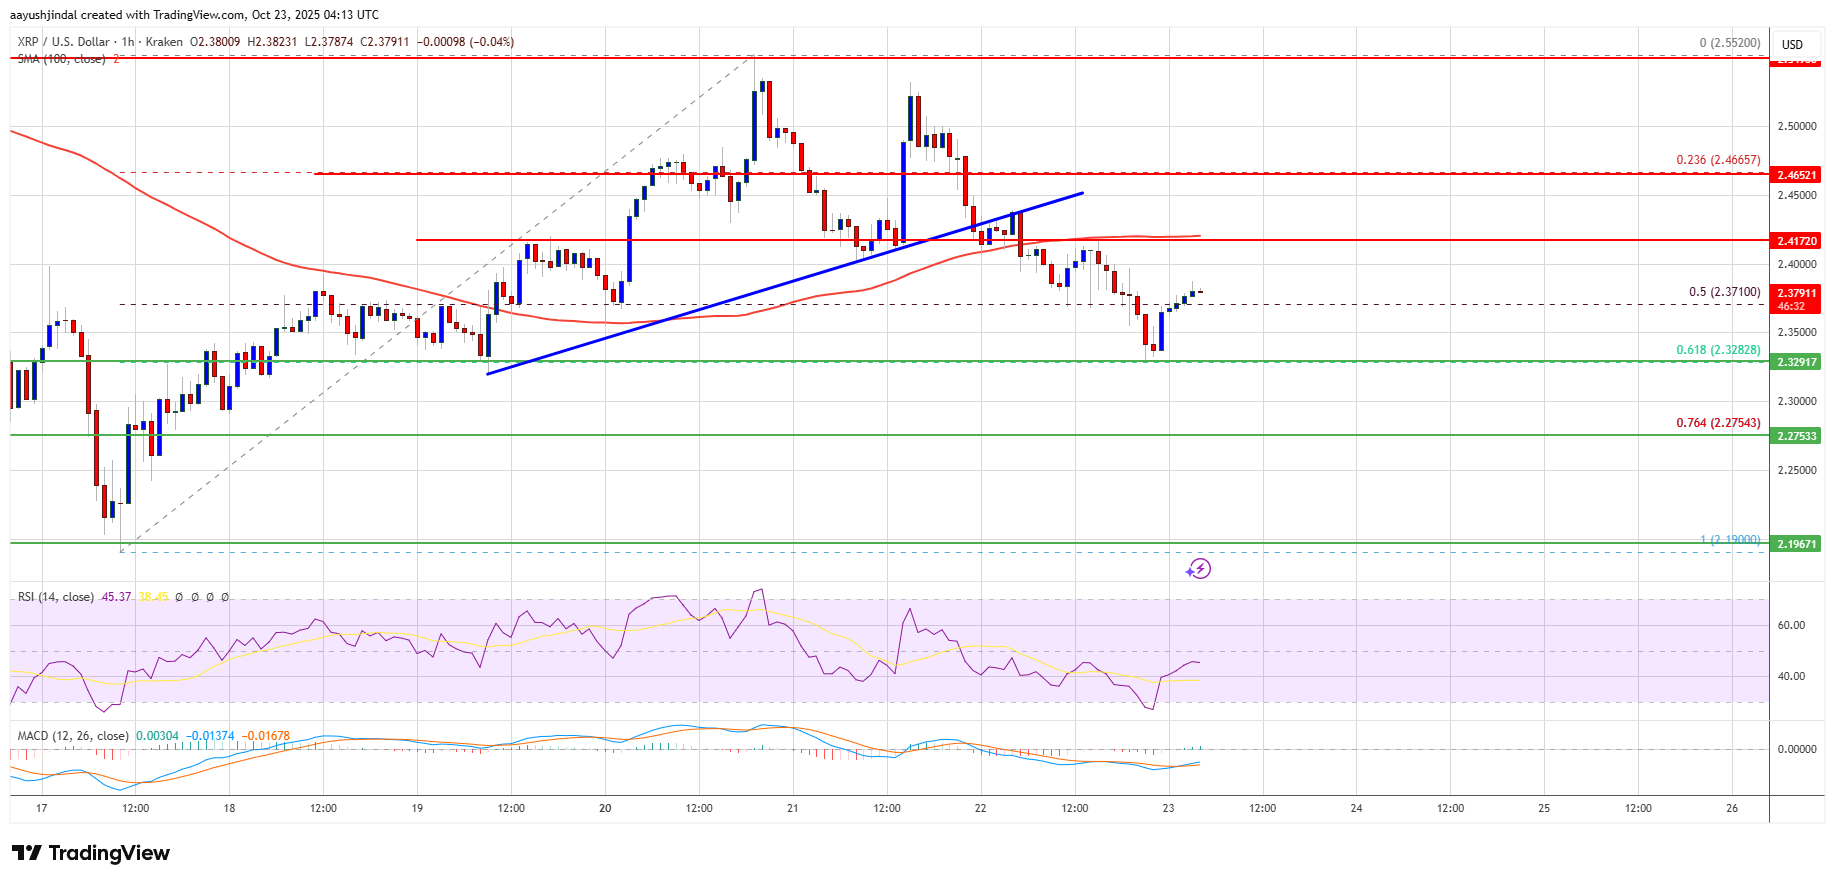
- There was a break below a connecting bullish trend line with support at $2.320 on the hourly chart of the XRP/USD pair (data source from Kraken).
- The pair could start a fresh increase if it clears the $2.450 resistance.
XRP price formed a base above $2.250 and started a recovery wave, like Bitcoin and Ethereum. The price surpassed the $2.40 and $2.420 resistance levels.
The bulls were able to push the price above $2.50. However, the bears remained active near the $2.550 level. A high was formed at $2.5520 and the price recently corrected some gains. It dipped below the 50% Fib retracement level of the upward move from the $2.190 swing low to the $2.5520 high.
Besides, there was a break below a connecting bullish trend line with support at $2.320 on the hourly chart of the XRP/USD pair. The price is now trading below $2.420 and the 100-hourly Simple Moving Average.
If there is a fresh upward move, the price might face resistance near the $2.420 level. The first major resistance is near the $2.50 level, above which the price could rise and test $2.550.
A clear move above the $2.550 resistance might send the price toward the $2.580 resistance. Any more gains might send the price toward the $2.650 resistance. The next major hurdle for the bulls might be near $2.720.
Another Drop?If XRP fails to clear the $2.420 resistance zone, it could start a fresh decline. Initial support on the downside is near the $2.320 level and the 61.8% Fib retracement level of the upward move from the $2.190 swing low to the $2.5520 high. The next major support is near the $2.2750 level.
If there is a downside break and a close below the $2.2750 level, the price might continue to decline toward $2.220. The next major support sits near the $2.20 zone, below which the price could continue lower toward $2.120.
Technical Indicators
Hourly MACD – The MACD for XRP/USD is now gaining pace in the bearish zone.
Hourly RSI (Relative Strength Index) – The RSI for XRP/USD is now below the 50 level.
Major Support Levels – $2.320 and $2.2750.
Major Resistance Levels – $2.420 and $2.50.
Original source
Read on NewsBTCRelated market context

Ethereum Price Prediction: 3 Million ETH Rushes Into Staking as Sellers Vanish
Is nobody leaving Ethereum? A record 36 million ETH is now locked in staking, roughly 29–30% of the circulating supply, and the va...

Most Traders Will Scroll Past This Grok AI Bitcoin Predicts, Big Mistake
Elon Musk Grok AI just looked at a Bitcoin chart down more than 50% and predicts it’s a classic accumulation zone, targeting $150,...

XRP Price Prediction: Japan Regulates Crypto like Stocks, XRP to Benefit First
Japan just rewrote the rules. XRP price is battling below resistance at $1.10, but it’s prediction is getting bullish as Japan’s p...

XRP Price Prediction: Japan XRP ETF Listing is Getting Closer
Japan just handed XRP bulls a major regulatory tailwind. XRP price is retesting a congestion zone, and the prediction could turn b...

The 3-Part Impulse That Shows Where The XRP Price Is Headed Next
XRP bulls are trying to turn a brutal selloff into something bigger than a relief bounce. An interesting setup shows a possible th...

Bitcoin price faces new risk as big buyers lose conviction
Bitcoin’s largest buyers are no longer behaving like a reliable backstop for the largest cryptocurrency. The exchange-traded funds...