XRP Price Uphill Task: Can It Break Through the Resistance?
XRP price is consolidating above the $0.5400 level. The price must clear the $0.5520 and $0.5600 resistance levels to start a recovery wave. XRP price is struggling to gain pace for a move above the $0.5550 zone. The pri...

XRP price is consolidating above the $0.5400 level. The price must clear the $0.5520 and $0.5600 resistance levels to start a recovery wave.
- XRP price is struggling to gain pace for a move above the $0.5550 zone.
- The price is now trading below $0.550 and the 100-hourly Simple Moving Average.
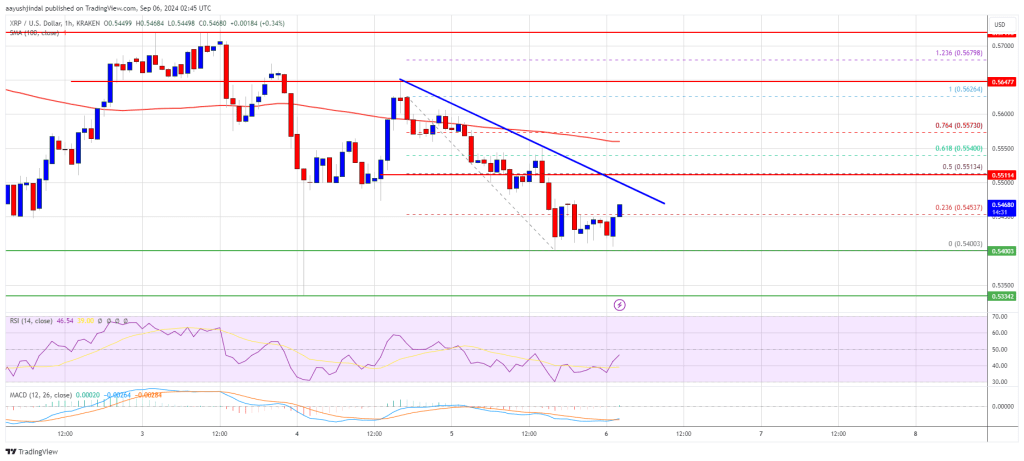
- There is a connecting bearish trend line forming with resistance at $0.550 on the hourly chart of the XRP/USD pair (data source from Kraken).
- The pair could decline again if it fails to clear $0.5520 and $0.5600.
XRP price remained in a range below $0.5650 like Bitcoin and Ethereum. There was a fresh decline, and the price retested the $0.540 support zone. A low was formed at $0.5400 and the price is now consolidating.
There was a minor increase above the $0.5420 level. The price surpassed the 23.6% Fib retracement level of the downward move from the $0.5647 swing high to the $0.5400 low. However, the bears seem to be active near the $0.550 and $0.5520 levels.
The price is now trading below $0.550 and the 100-hourly Simple Moving Average. On the upside, the price might face resistance near the $0.550 level. There is also a connecting bearish trend line forming with resistance at $0.550 on the hourly chart of the XRP/USD pair.
The first major resistance is near the $0.5550 level or the 76.4% Fib retracement level of the downward move from the $0.5647 swing high to the $0.5400 low.
The next key resistance could be $0.5600. A clear move above the $0.5600 resistance might send the price toward the $0.5650 resistance. The next major resistance is near the $0.5720 level. Any more gains might send the price toward the $0.5880 resistance or even $0.600 in the near term.
Another Decline?If XRP fails to clear the $0.5550 resistance zone, it could start another decline. Initial support on the downside is near the $0.5420 level. The next major support is $0.5400.
If there is a downside break and a close below the $0.5400 level, the price might continue to decline toward the $0.5320 support in the near term. The next major support sits at $0.5250.
Technical Indicators
Hourly MACD – The MACD for XRP/USD is now losing pace in the bearish zone.
Hourly RSI (Relative Strength Index) – The RSI for XRP/USD is now below the 50 level.
Major Support Levels – $0.5400 and $0.5320.
Major Resistance Levels – $0.5500 and $0.5600.
Original source
Read on NewsBTCRelated market context

Uranium Holds Above $85 as Mining ETF Rebounds From June Sell-Off
The latest charts display that the market is divided into stable physical prices and uranium shares trying to regain momentum afte...

Bitcoin price faces new risk as big buyers lose conviction
Bitcoin’s largest buyers are no longer behaving like a reliable backstop for the largest cryptocurrency. The exchange-traded funds...

Elon Musk’s trillionaire status puts his net worth above crypto’s entire market cap outside Bitcoin
Elon Musk has become the first person in modern history to amass a personal net worth exceeding $1 trillion, crossing the historic...

Bitcoin price challenges $64,000 weekend wall – needing a breakout or risk a deeper correction
Bitcoin reclaimed $64,000 on June 12 and touched an intraday high of $64,301 in the same session that spot ETF flows finally flipp...

Bitcoin rises above $64,000 after Pakistan prime minister says Iran peace deal is near
Bitcoin traded above $64,000 on Saturday, supported by its strongest ETF inflows in a month and growing optimism around geopolitic...

Standard Chartered Says Bitcoin Bottomed Near $59,000 As Crypto Winter Ends
TL;DR Standard Chartered’s Geoffrey Kendrick reportedly says Bitcoin’s $59,000 area marked the cycle bottom. The note cites SpaceX...