XRP Retrace Is Only Temporary, What Happens Once the Uptrend Resumes
XRP’s price action has transitioned into a falling phase after a multi-day rally at the start of the year, but technical analysis implies this may be part of a bullish structure. After climbing from below $2 on January 1...
Archive context
Older archive item. Useful for background and entity history, but not a fresh market-moving signal.
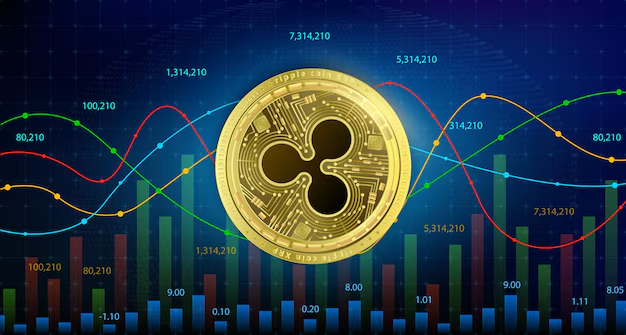
XRP’s price action has transitioned into a falling phase after a multi-day rally at the start of the year, but technical analysis implies this may be part of a bullish structure.
After climbing from below $2 on January 1 to $2.41 on January 6, the market has begun digesting those gains. Now, the outlook is whether short-term Fib price levels can hold as momentum resets, with the next directional move expected to define XRP’s near-term trajectory.
XRP’s Rally Sets Context For Current PullbackXRP’s current price action in the past 24 hours is tracing out a downward retracement. Notably, this retracement follows a strong upward move that began at the start of the week. To put this in context, XRP opened in January 2026 at around $1.85, but shot up to as high as $2 on January 6, equating to a 30% increase within that timeframe.
On January 4, XRP was trading roughly between $2.01 and $2.12 before demand accelerated. By January 5, intraday price action expanded into the $2.09 to $2.36 range, reflecting a clear pickup in momentum. The rally extended into January 6 and 7, when XRP briefly pushed above $2.41 before sellers began to step in.
According to technical analysis shared on X by TARA, the pullback pushed the XRP price to the 0.236 Fibonacci retracement, which comes in around $2.27. This level has quickly turned into an important area of interest, as it represents the first meaningful support following the recent impulse higher. The chart accompanying the analysis shows price reacting cleanly around this zone, with XRP falling in one quick sweep on the 4-hour candlestick timeframe.
What To Expect Next For XRPMomentum indicators on the chart suggest that the correction is still unfolding, but not in a way that signals structural weakness. The 14-SMA is rising toward price and might act as dynamic support, which often helps limit downside during healthy retracements.
According to the analyst, XRP needs to revisit the $2.30 to $2.33 area during this corrective wave. That region previously acted as resistance and may now determine whether the pullback remains shallow or extends further.
If XRP fails to reclaim that zone, the analysis points to a deeper but still technical retrace toward the 0.382 Fibonacci level around $2.18. Even in that scenario, the move would remain consistent with a strong trend cooling off, rather than a breakdown of bullish structure.
Despite the ongoing correction, the broader outlook outlined in the analysis is optimistic. XRP is likely to return to its previous highs once the retrace finds a confirmed low. Based on the current structure, upside targets are projected in the $2.49 to $2.66 range, but adjustments are expected depending on where the correction ultimately bottoms.
Why this matters
XRP is a tracked market entity in the DigitalMoneyBox archive, making this useful context for readers monitoring repeated mentions and follow-up coverage.
Original source
Read on NewsBTCRelated market context

XRP Price Could Surge 145% as 2023 Rally Pattern Returns
XRP price traded near $1.34 on October 16, about 4% below the 200-day simple moving average (SMA) at $1.36. The immediate test is...

Google Gemini AI Predicts Bitcoin to Hit $175K by 2027
When prompted, Google Gemini AI predicts that by January 1, 2027, Bitcoin could be trading for $175,000. It gives a hypothetical c...

ChatGPT AI Predicts Million-Dollar Bitcoin by 2027
ChatGPT AI predicts Bitcoin will hit $1M+, which isn’t a crazy call, since many analysts share the same view. What makes this pred...
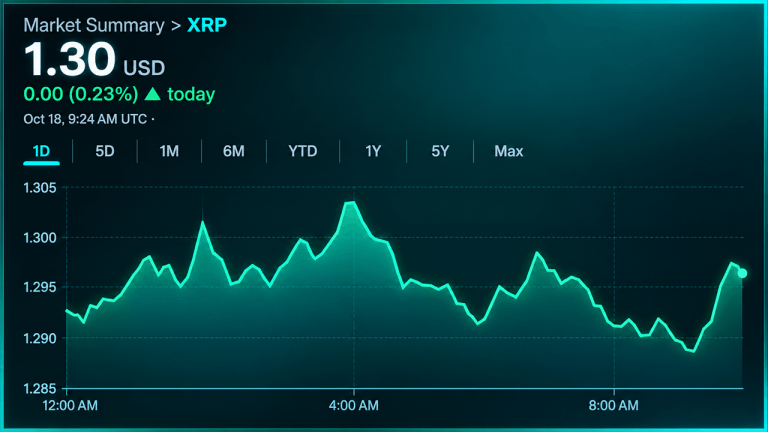
XRP Price Battles $1.30 as $2.77B Futures Market Loses Momentum
XRP’s price is fighting to hold $1.29 as its $2.77 billion futures market loses momentum and sellers maintain control. Technical i...
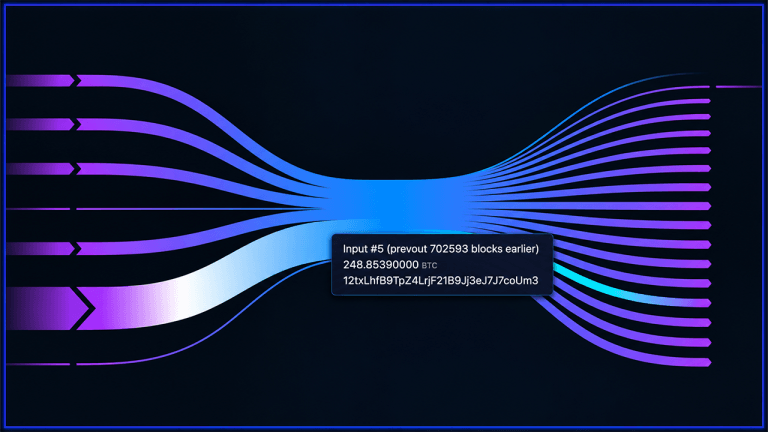
Bitcoin’s Old Guard Stirs as 13-Year-Old Wallets Move Millions
Two bitcoin addresses dating to 2013 collectively moved approximately $34 million in bitcoin within five seconds on Saturday, Oct....

Circle Targets 40 New Markets As USDC Push Moves Beyond Crypto Trading
TL;DR: Circle plans to expand USDC infrastructure into approximately 40 developing and emerging markets. The company is targeting...