XRP Set For Monumental Rally: Analyst Points To Extremely Rare Signal
The latest chart analysis by crypto analyst @Cryptobilbuwoo0, published via X, offers a compelling narrative for XRP’s potential upward trajectory when juxtaposed against the total cryptocurrency market capitalization. T...
Archive context
Older archive item. Useful for background and entity history, but not a fresh market-moving signal.

The latest chart analysis by crypto analyst @Cryptobilbuwoo0, published via X, offers a compelling narrative for XRP’s potential upward trajectory when juxtaposed against the total cryptocurrency market capitalization. The analyst emphasizes key technical indicators and historical patterns, suggesting that XRP might be on the brink of a significant bullish phase.
XRP Price Poised To “Bounce”The XRP/Total chart primarily illustrates a descending trajectory that began forming from its early 2018 peak. This overarching downtrend is marked by successive lower highs that articulate a consistent descending trendline.
Moreover, @Cryptobilbuwoo0 highlights the ‘Bounce Back Line,’ a horizontal support line that has historically acted as a crucial reversal point for the XRP price action. The chart shows several instances where the price of XRP, upon reaching this line, has rebounded dramatically.
The last instance of XRP interacting with the “Bounce Back Line” was on December 28, 2020. Following this touchpoint, the price soared over 1,100%, climbing from $0.18 to $2. Earlier, on February 27, 2017, XRP escalated from just under $0.02 to $3.35 within 10 months. Currently, XRP is once again nearing the “Bounce Back Line.” Given the historic outcomes following support from this level, the analyst predicts another significant rally may be on the horizon.
The chart analysis further deepens with a nuanced look at the Relative Strength Index (RSI) and the Wavetrend Indicator (WT Krypt), which are pivotal to understanding the market’s momentum and potential reversals. The 14-day RSI is currently nearing 31, approaching the oversold territory which historically signals a buying opportunity or a trend reversal. This is evident in the past markings on the chart, where similar RSI levels have coincided with the “Bounce Back Line” and substantial upward price movements.
The Wavetrend Indicator, used for spotting the start and end of cycles in the cryptocurrency’s price, has shown several bullish signs. Bullish divergences have been a critical focus, occurring when the price of XRP makes new lows while the indicator does not follow suit, suggesting a decrease in downward momentum. Moreover, the recent crossover of the Wavetrend lines (red crossing over blue) is typically interpreted as a bullish entry signal, indicating potential upward price movement.
In addition to the primary indicators, the analyst has annotated the chart with past price actions and highlighted areas and patterns, such as bullish divergences. These annotations serve to emphasize significant trading zones and anticipated trend shifts based on historical data. The marked sections of the chart indicate that each time similar conditions were met, there followed a significant increase in the XRP price, reinforcing the bullish outlook presented in the current analysis.
@Cryptobilbuwoo0’s analysis suggests that XRP, currently positioned at a historically significant price level and supported by bullish indicator signals, is poised for a potential breakout. This outlook is bolstered by the RSI nearing oversold conditions and the positive signals from the Wavetrend Indicator. If the historical pattern repeats, the crypto asset could see a substantial rally, affirming the analyst’s perspective:
Looking at the XRP/Total chart, XRP has always risen significantly from the rebound line. Indicators are also calling the bulls. XRP always moves alone like a maverick. XRP’s showtime begins.
At press time, XRP traded at $0.49.
Why this matters
This altcoin story adds another data point to the current market tape and is useful when read alongside nearby source coverage.
Original source
Read on NewsBTCRelated market context

Ethereum News: Double Three Pattern Hints at Another Rally
Ethereum trades at $2,520, sitting right at the pivot point most analysts have flagged in news outlets for weeks. That’s not a coi...

Arthur Hayes calls EUR/JPY prices crypto’s smoke alarm, but the Fed’s plumbing still shows no fire
Arthur Hayes has a new market alarm for crypto traders: EUR/JPY. The pair has started to fall, yet the Federal Reserve channels th...
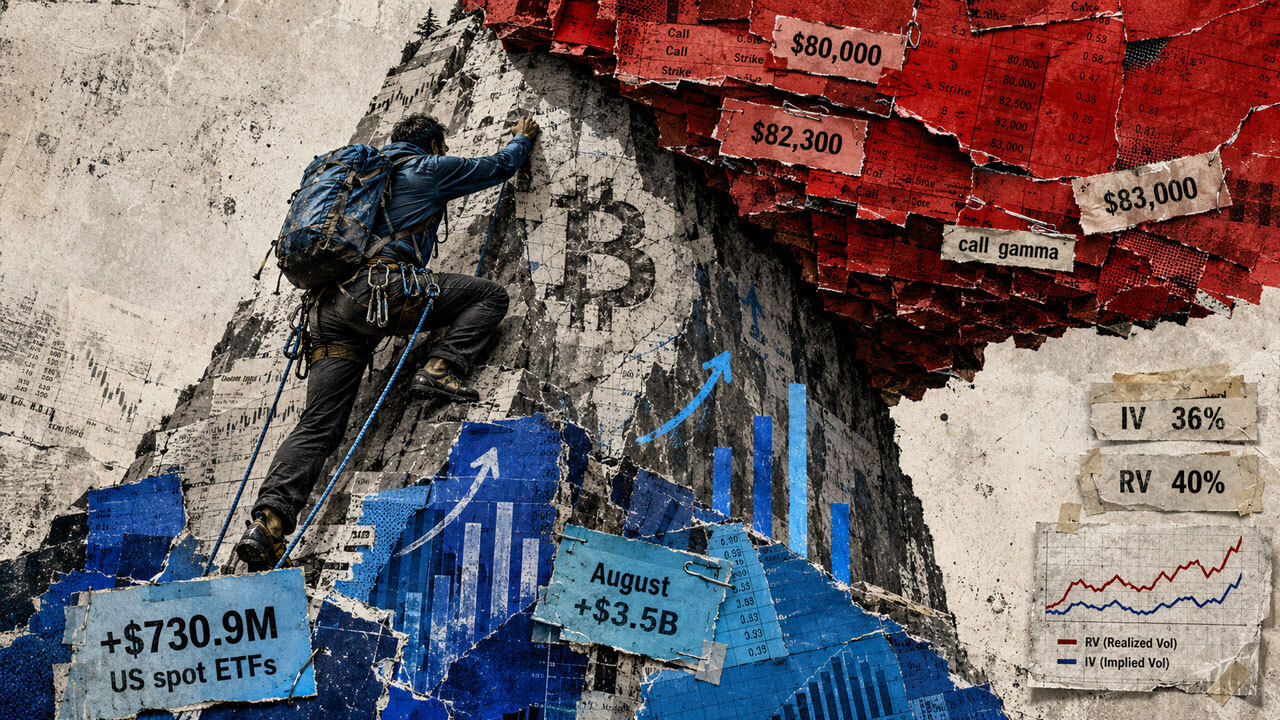
Bitcoin’s rally over $81,000 is finding real buyers, but options traders still aren’t pricing a clean breakout
Bitcoin accelerated above $81,000 on Thursday as easing rate fears and fresh institutional demand lifted the broader crypto market...

Bitcoin News: BTC to Gold Ratio Hits 18 as Both Assets Rally
Bitcoin now buys 18 ounces of gold, the highest reading on that ratio since January, and it’s climbing while both assets rally tog...

Gate.io Referral Code 2026: BgdCUgtf (100 USDT + $6,666 in Bonuses)
Gate.io referral code is a special promo code that opens up premium benefits for users who are new to the platform. The best Gate....
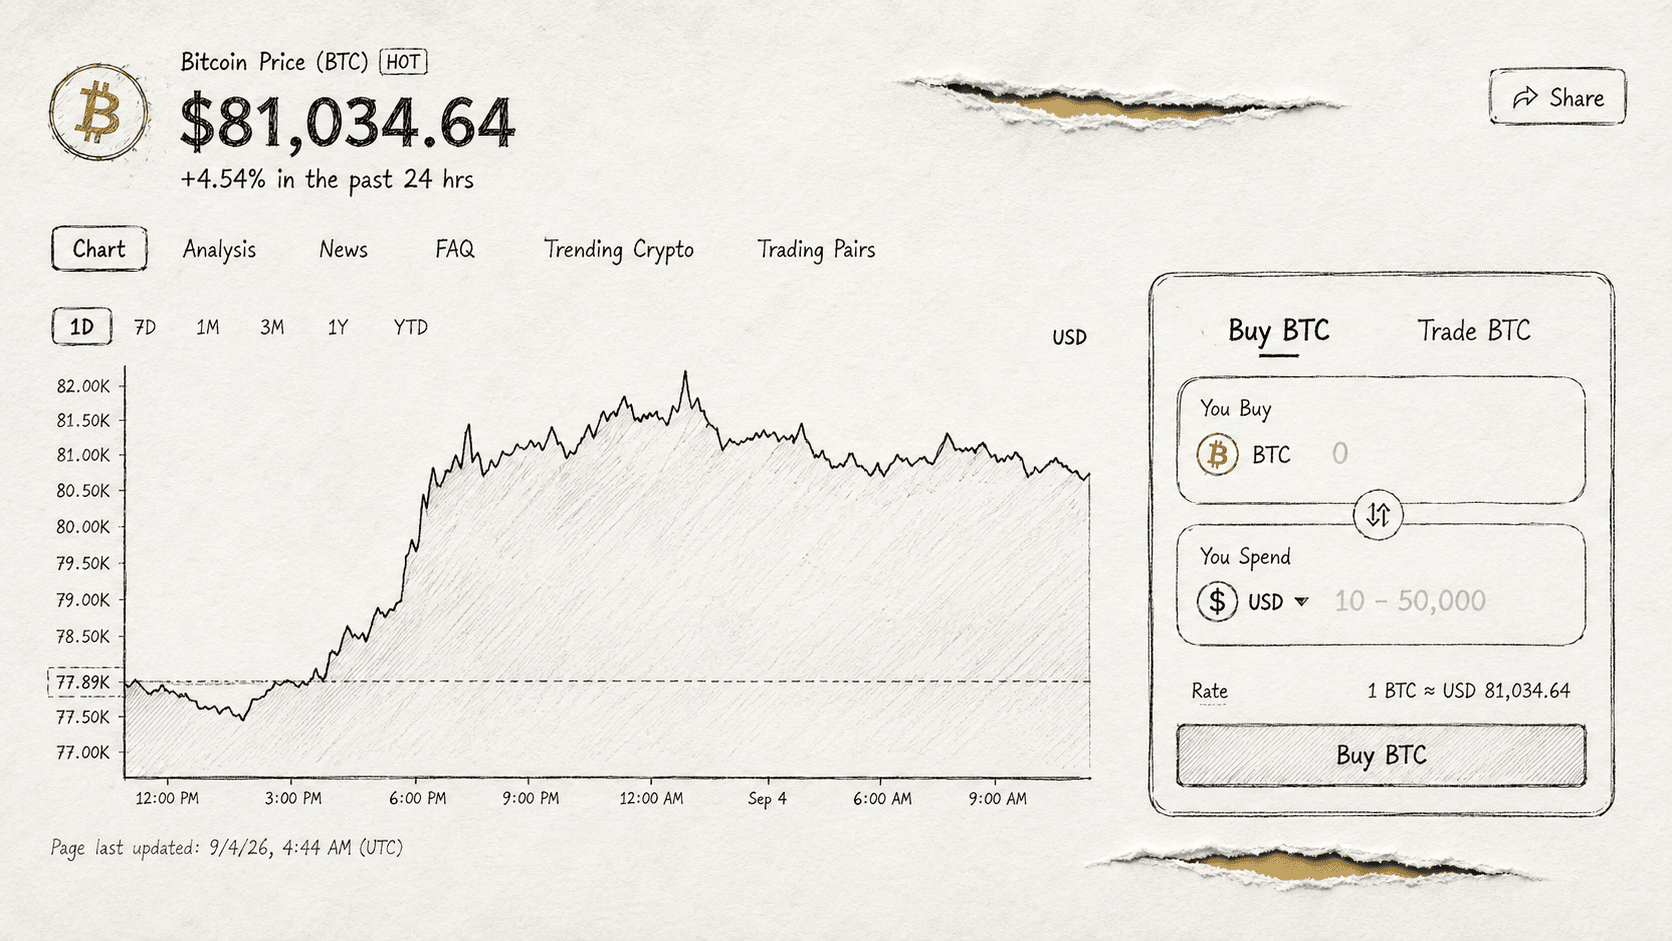
Bitcoin Back Above $80,000 as Traders Cut September Fed Hike Odds to a Coin Flip
Bitcoin has traded as high as $82,000 in the past 24 hours, before shedding some of its gains to most recently to trade at $80,718...