XRP Stalls Below Key Resistance, But Setup Aligns For An Elliott Wave Finish
XRP is showing signs of hesitation after a strong rebound, struggling to push past key resistance levels. The recent price action fits neatly within an Elliott Wave pattern, suggesting the market may be entering its fina...
Archive context
Older archive item. Useful for background and entity history, but not a fresh market-moving signal.
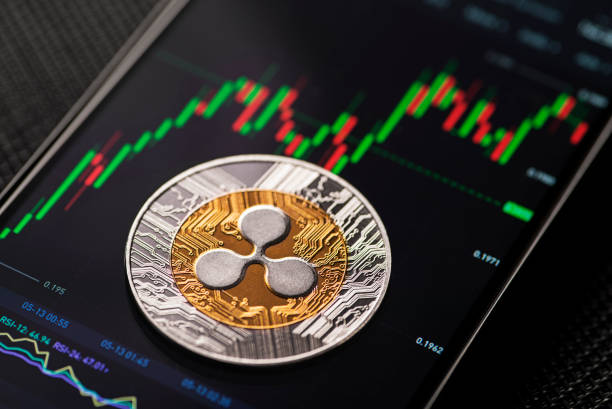
XRP is showing signs of hesitation after a strong rebound, struggling to push past key resistance levels. The recent price action fits neatly within an Elliott Wave pattern, suggesting the market may be entering its final consolidation phase before the next major move unfolds.
Market Pauses After The StormCasiTrades, in a recent market update, explained that following last Friday’s sharp wipeout, prices managed to rebound impressively, but that momentum now appears to be losing steam. According to the analyst, such pauses are natural after strong moves. In Elliott Wave Theory (EWT), this type of slowdown aligns with Wave 4, a stage where the market consolidates before preparing for the final impulsive wave.
The analyst emphasized that markets rarely pivot directly after a major Wave 3 decline. Instead, they often complete an exhausted Wave 5 move to wrap up the impulse cycle before a fresh uptrend begins. However, CasiTrades noted that the market has not yet shown the kind of strength needed to invalidate the final dip.
Price action is currently stalling around Wave 4 resistance levels. If the market were truly in a sharp V-shaped recovery, it should have already cleared the $2.82 resistance mark with strong momentum, but that has yet to happen. Given these conditions, the analyst believes that the market may still need one more wave down to fully exhaust selling pressure and reset sentiment.
Market Data Chaos: No “Universal” XRP ChartCasiTrades went on to emphasize that market data across exchanges has become highly inconsistent, making accurate analysis challenging. The analyst pointed out that each trading platform displayed a different low during the recent crash, with some pairs dipping below $1, while others managed to hold at much higher levels. With this disparity, CasiTrades advised traders to focus on the exchange they are personally trading on to ensure precision, as there is no “universal” XRP chart.
According to the analyst, on Binance USD, XRP’s price wicked as low as $0.77, marking a sharp 72% drop from local highs and falling below the 0.786 Fibonacci retracement level. While CasiTrades believes such extreme lows are unlikely to repeat, the next potential retracement levels around $1.46 (0.618 Fib) and the golden pocket near $1.35 remain key areas of interest. These zones align with multiple technical factors, including Wave 5 extensions, macro Fibonacci retracements, and Wave 2 targets.
The analyst explained that if XRP were to retest these deeper levels, it could trigger a powerful reversal, potentially setting the stage for the long-anticipated impulsive wave that targets the $6.50 to $10.00 range.
Despite the chaos caused by the recent market crash, CasiTrades sees a potential silver lining. She noted that the crash might have shifted XRP’s structure from a shallow Wave 4 correction to a broader macro Wave 2 retracement, which may precede the strongest impulse waves in the cycle.
Why this matters
This altcoin story adds another data point to the current market tape and is useful when read alongside nearby source coverage.
Original source
Read on NewsBTCRelated market context

Ethereum (ETH) Price Prediction: Whale Rotates $155M Into ETH as Longs Surge Near $2,500
Ethereum is trying to stabilize after another volatile stretch, with price returning toward the mid-$2,400 region while several po...

Bank Lobby Presses OCC For Clarity On Stablecoin Rewards After Final Rule
A final stablecoin rule has not ended the argument over rewards. The Bank Policy Institute used its October 24 newsletter to renew...
Peter Schiff Warns Bitcoin Could Hit $75K After BTC Fell Below $80K
Peter Schiff sees $75K as bitcoin’s next likely stop after its drop below $80K. The warning follows his concerns about weakening t...

Bitcoin (BTC) Price Prediction: $74K Liquidity Gap Puts $80K Support to the Test
Meanwhile, data from Glassnode and Fasanara Digital show that traditional financial assets are capturing a growing share of deriva...

Bitcoin Slips Below $80,000 as US Evacuations Across the Middle East Spark Risk-Off Weekend
Bitcoin slid to a one-month low near $79,700 as the US evacuated Middle East personnel over Iranian attack threats. Ether, XRP and...

Bitcoin Slides Below $80,000 as US Evacuations Stoke Iran Fears
Bitcoin slid below $80,000 to a one-month low as US evacuations across the Middle East stoked Iran attack fears. Ether, XRP and so...