XRP Triangle Hints At Potential 10% Move—But In Which Direction?
An analyst has pointed out how XRP could be set up for a potential 10% move based on a technical analysis (TA) pattern in its 15 minutes price. XRP Has Possibly Been Trading Inside A Symmetrical Triangle In a new post on...
Archive context
Older archive item. Useful for background and entity history, but not a fresh market-moving signal.

An analyst has pointed out how XRP could be set up for a potential 10% move based on a technical analysis (TA) pattern in its 15 minutes price.
XRP Has Possibly Been Trading Inside A Symmetrical TriangleIn a new post on X, analyst Ali Martinez has talked about a Triangle that XRP has been trading inside on the 15-minute timeframe. A “Triangle” is a TA pattern that appears whenever an asset consolidates between two converging trendlines.
The upper line of the pattern tends to be a source of resistance, while the lower one that of support. An escape beyond either boundary usually signals a breakout in that direction.
Triangles can be of a few different types based on the orientation of their trendlines. Triangles that have one line parallel to the time-axis fall in either the Ascending or Descending categories. The pattern is an Ascending Triangle when the upper level is the parallel line, while it’s a Descending Triangle if the consolidation range shrinks to a downside.
When both trendlines approach each other at a roughly equal and opposite slope, the pattern formed is known as a Symmetrical Triangle. This is the case that’s relevant in the current discussion.
In a Symmetrical Triangle, the consolidation shrinks in an exactly sideways manner. As an asset moves through this pattern, its range gets narrower until it compresses down to a single point around the midline.
Now, here is the chart shared by the analyst that shows the Symmetrical Triangle that the 15-minute price of XRP has been traveling inside recently:
As displayed in the above graph, the 15-minute XRP price retested the lower level of the Symmetrical Triangle on Christmas and found support at it. This could be a potential sign that the channel is holding for now.
As mentioned earlier, any level of a Triangle not holding up can signal a continuation of trend in that direction. This means that a surge above the channel can be a bullish sign, while a fall under it a bearish one.
For Ascending and Descending Triangles, it’s usually considered that they have a direction bias attached to them, with Ascending Triangles being more likely to lead to bullish breakouts, while Descending Triangles to bearish breakdowns.
In Symmetrical Triangles, though, the two lines are roughly identical, just mirrored, so breakouts could be equally probable in both directions. As such, it’s hard to say where XRP might escape from this Symmetrical Triangle.
As for what might be the magnitude of the move a breakout could lead to, the analyst has noted it could potentially be of 10%. This is based on the fact that breakouts from consolidation channels are considered to end up being of the same length as the distance between the trendlines.
XRP PriceAt the time of writing, XRP is trading around $1.84, down 3.3% over the last week.
Why this matters
This altcoin story adds another data point to the current market tape and is useful when read alongside nearby source coverage.
Original source
Read on NewsBTCRelated market context

Circle mints 250M USDC on Solana, boosting liquidity and network potential
Increased USDC supply on Solana may enhance network activity and adoption, but market caution persists regarding significant price...
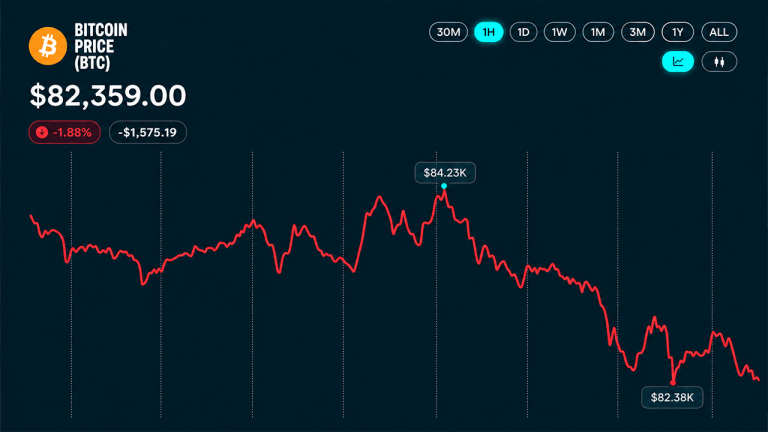
Bitcoin Price Faces CPI Reckoning as Analysts Eye $81,300 Support
Bitcoin’s price is hovering near $82,400 on Monday afternoon as Wall Street delivers a mixed performance across major indexes. Inv...
Tom Lee’s Bitmine Nears 5% of Ether Supply, Trims Weekly Buy to 12,532 ETH
Bitmine Immersion Technologies (NYSE: BMNR) held 6,028,946 ETH as of Oct. 11, the Ethereum treasury company said in a press releas...

Bitmine adds 12,532 ETH as Tom Lee flags potential ‘largest-ever’ crypto bull market
Bitmine (BMNR) added 12,532 ETH last week, lifting its Ethereum treasury to 6.03 million tokens, or 4.9% of supply, with 84% stake...

Ledger wallet implant exposes a gap in its authenticity check
Ledger has confirmed an unauthorized hardware implant in one affected customer's wallet as independent investigators estimate $93....

Bitcoin companies are learning that holding forever takes cash
Metaplanet sold 10,000 BTC and bought back 11,000 at a higher average price to show it was willing to sell its Bitcoin. The Japane...