XRP Wave C Push On The Way: What Could Send Price Below $2?
XRP’s price action is trading just above $2, but technical analysis of mid-term charts shows a more complex corrective structure for what comes next. According to a technical analysis shared by CasiTrades on X, XRP may s...
Archive context
Older archive item. Useful for background and entity history, but not a fresh market-moving signal.

XRP’s price action is trading just above $2, but technical analysis of mid-term charts shows a more complex corrective structure for what comes next.
According to a technical analysis shared by CasiTrades on X, XRP may still have one more bullish push ahead before the structure turns lower. The chart showing the analysis outlines a developing Elliott Wave sequence that could first lift XRP’s price higher, then open the door to a breakdown if support levels fail.
B Wave Dips Hint At Coming Wave C SurgeTechnical analysis of XRP’s price action on the 1-hour candlestick timeframe chart by CasiTrade proposes an interesting outlook that shows XRP might end up correcting below $2 in the coming days. This correction, however, will only play out after XRP finishes a Wave C move that takes its price above $2.2.
The wave C, in turn, is expected to play out after the recent pullback to $2.03 in the past 48 hours. According to CasiTrades, XRP’s recent pullback unfolded as a deeper B wave than initially expected. Instead of forming a tight consolidation, price traced out a full ABC move and fell into the 0.618 Fibonacci retracement around $2.09. This depth, however, does not invalidate the structure. Such a move is consistent with a B wave in the Elliott Wave theory.
This retracement coincides with clustered Fibonacci levels and prior intraday support, and the next possible move from here is the next leg higher within the larger Wave 2 structure.
Now that the B wave is likely in place, the attention is towards the anticipated C wave push. CasiTrades identifies the golden retracement near $2.26 as the primary upside target, with a possible extension into the $2.28 region where the golden pocket and the 1.236 extension converge. The chart highlights this zone as a dense resistance area, reinforced by prior reaction highs and overlapping Fibonacci projections.
This C wave is expected to subdivide into five smaller waves. If this plays out as expected, XRP’s price action should feel bullish through its clean subwave development. However, the way price behaves as it approaches and reacts to the $2.26 to $2.28 band will be critical for confirming the broader outlook and if a correction is next.
XRP Price Chart. Source: @CasiTrades on X
A Post-C Rejection Could Drag XRP To $1.65The current focus is on a possible push higher, but there’s still a downside risk after the C wave is complete. The analyst expects a rejection that could become the beginning of a larger Wave 3 move to the downside after XRP reaches the projected levels around $2.26 to $2.28.
If that rejection materializes cleanly, XRP could begin a sustained move lower, with the macro support region around $1.65 coming back into focus. Confirmation of this bearish path, however, depends on how the C subwaves form and whether price delivers a decisive rejection.
Featured image from Unsplash, chart from TradingView
Why this matters
XRP is a tracked market entity in the DigitalMoneyBox archive, making this useful context for readers monitoring repeated mentions and follow-up coverage.
Original source
Read on NewsBTCRelated market context

Circle Targets 40 New Markets As USDC Push Moves Beyond Crypto Trading
TL;DR: Circle plans to expand USDC infrastructure into approximately 40 developing and emerging markets. The company is targeting...

Polymarket Bitcoin and Rate Hike Odds Shift as CME Says No Change
Polymarket put the odds of a 25-basis-point Federal Reserve rate hike in October at 23%, with $43 million traded, while CME FedWat...

ChatGPT AI Predicts Million-Dollar Bitcoin by 2027
ChatGPT AI predicts Bitcoin will hit $1M+, which isn’t a crazy call, since many analysts share the same view. What makes this pred...
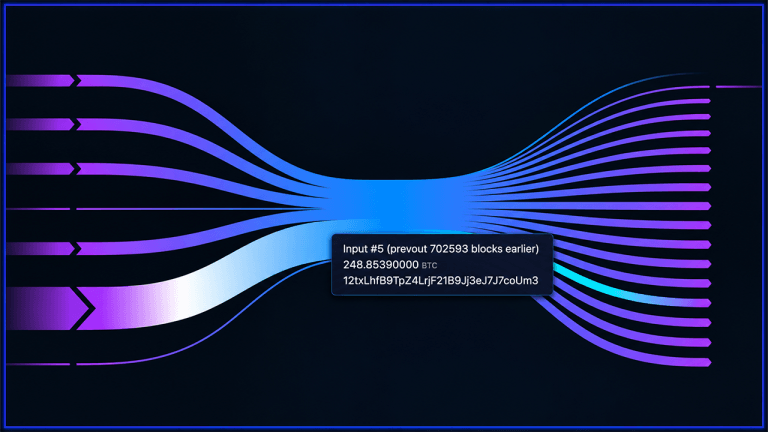
Bitcoin’s Old Guard Stirs as 13-Year-Old Wallets Move Millions
Two bitcoin addresses dating to 2013 collectively moved approximately $34 million in bitcoin within five seconds on Saturday, Oct....
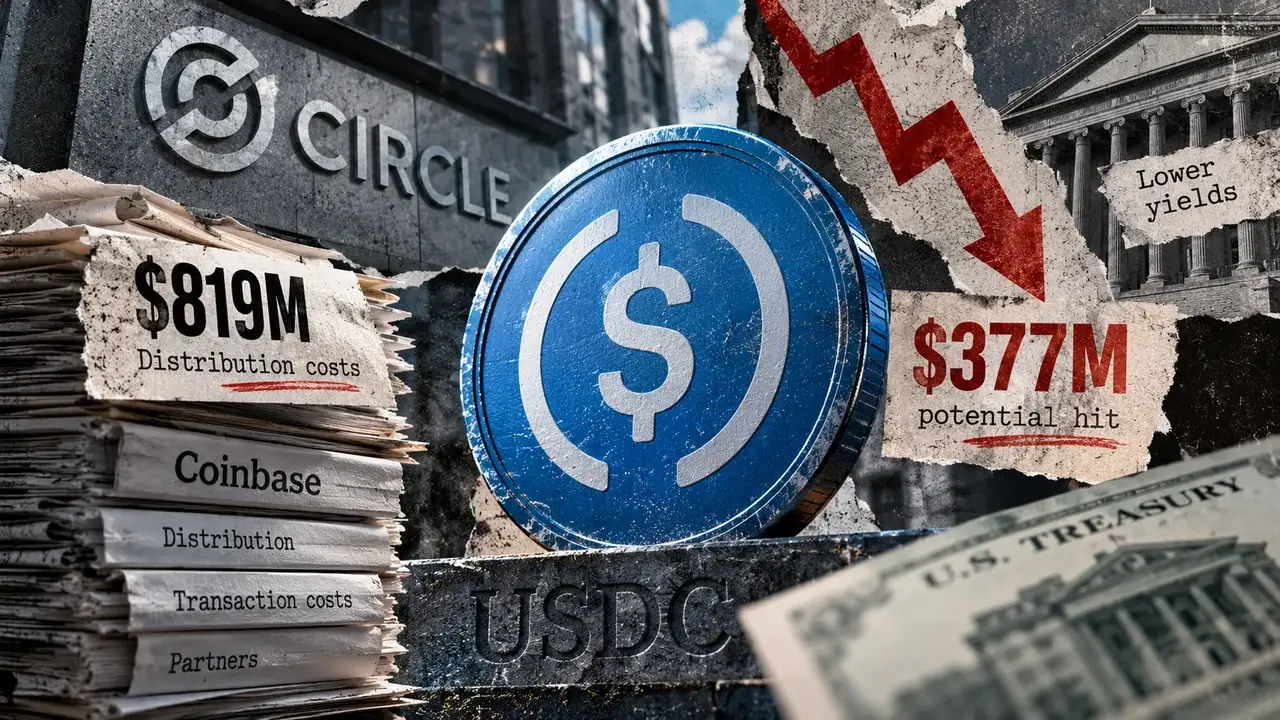
USDC processed $36 trillion in H1 transactions, but Circle kept just 7 cents of every revenue dollar
Stablecoin issuer Circle spent 93% of its first-half revenue on distribution, operations, and investment as USDC processed more th...

XRP Price Could Surge 145% as 2023 Rally Pattern Returns
XRP price traded near $1.34 on October 16, about 4% below the 200-day simple moving average (SMA) at $1.36. The immediate test is...