XRP Wyckoff Pattern Maps Bullish Run To $3.70 This Summer
Crypto analyst Charting Guy (@ChartingGuy), posting to X on April 20, has mapped the daily XRP/US Dollar chart on Bitstamp onto a textbook Wyckoff re‑accumulation schematic and argues that the pattern is now far enough a...
Archive context
Older archive item. Useful for background and entity history, but not a fresh market-moving signal.

Crypto analyst Charting Guy (@ChartingGuy), posting to X on April 20, has mapped the daily XRP/US Dollar chart on Bitstamp onto a textbook Wyckoff re‑accumulation schematic and argues that the pattern is now far enough advanced to imply a summer markup toward— and potentially beyond— the $3.70 region.
“Wyckoff Pattern Ignites XRP Bull CaseThe chart spans the five‑month base that began with preliminary supply (PSY) in late November. A vertical surge carried price into a $2.68 Buying Climax (BC) in early December, immediately followed by an Automatic Reaction (AR) that washed back to roughly $1.90, anchoring the lower boundary of what would become the Phase A trading range. A Secondary Test (ST) in mid‑December revisited the $2.72 zone, completing Wyckoff’s initial “stop‑action” sequence.
Phase B unfolded through January: demand rebuilt, producing an Up‑Thrust (UT) in Phase B that briefly pierced $3.40 in mid January before supply re‑asserted itself. From that peak XRP traced a descending, low‑angle channel—labelled the “Creek”—with progressively lower highs and lows into early April. Throughout this descent, Charting Guy’s overlay shows the familiar saw‑tooth of Wyckoff’s internal testing, suggesting weak‑hand distribution rather than true distributional topping.
On April 7 the market under‑cut range support, knifing to about $1.61, and immediately snapped back: the classic Spring of Phase C. A shallow Test of the spring followed near $2.00, satisfying Wyckoff’s requirement for bullish confirmation. From that point the analyst’s projected path turns higher.
Phase D begins with what Wyckoff called Last Point of Support (LPS) between $2.35 and $2.55 in early May, followed by a steeper advance that drives through the February crest. This is followed by a Jump Across The Creek (JATC)—a decisive thrust through the descending channel top and horizontal resistance at roughly $2.70.
The model then shows a price breakout above the mid-January high at $3.40 would constitute the Sign of Strength (SOS) around $3.40 in late May, completing the transition into Phase E. Afterwards, Charting Guy expects a second backing up into a first Last Point of Support (LPS) between $3.10 and $3.30 in mid-June, followed by an even steeper advance.
In Phase E the schematic accelerates, taking XRP into the $3.70 area by early July—an objective that sits one tick above the $3.40 resistance band on the analyst’s price axis. With the spot rate at $2.12 at publication time, the roadmap implies a potential upside of close to 74% over the next two and a half months.
However, Charting Guy cautions that “this doesn’t mean up‑only now—timing may be slightly off,” underscoring Wyckoff’s probabilistic nature. Nevertheless, the meticulous alignment of real‑world price action with the classical re‑accumulation phases—complete with labelled PSY, BC, AR, ST, UT, Spring, Test, LPS, JATC and SOS—adds weight to the bullish case. If the market respects those technical milestones, XRP could soon be working with prices not seen since the last cycle’s peaks.
At press time, XRP traded at $2.11.
Why this matters
This altcoin story adds another data point to the current market tape and is useful when read alongside nearby source coverage.
Original source
Read on NewsBTCRelated market context

Bitcoin (BTC) Price Prediction: Hidden Weekly RSI Divergence Warns of Pullback as BTC Tests $80K
Bitcoin price was trading around $80,500 on Bitstamp in the latest technical reading, up 3.11% on the session. While the price rem...

XRP News: Ripple Latest SEC Filing Shakes Holders
XRP is trading at $1.44, but the number that matters is buried in regulatory filing news. A new SEC document has holders re-readin...

Ethereum Price Faces Glamsterdam Test as 3X Network Speed Threatens Smart Contracts
Ethereum price is starting to stabilize, as the network’s next major upgrade puts its core economic assumptions under scrutiny. Th...
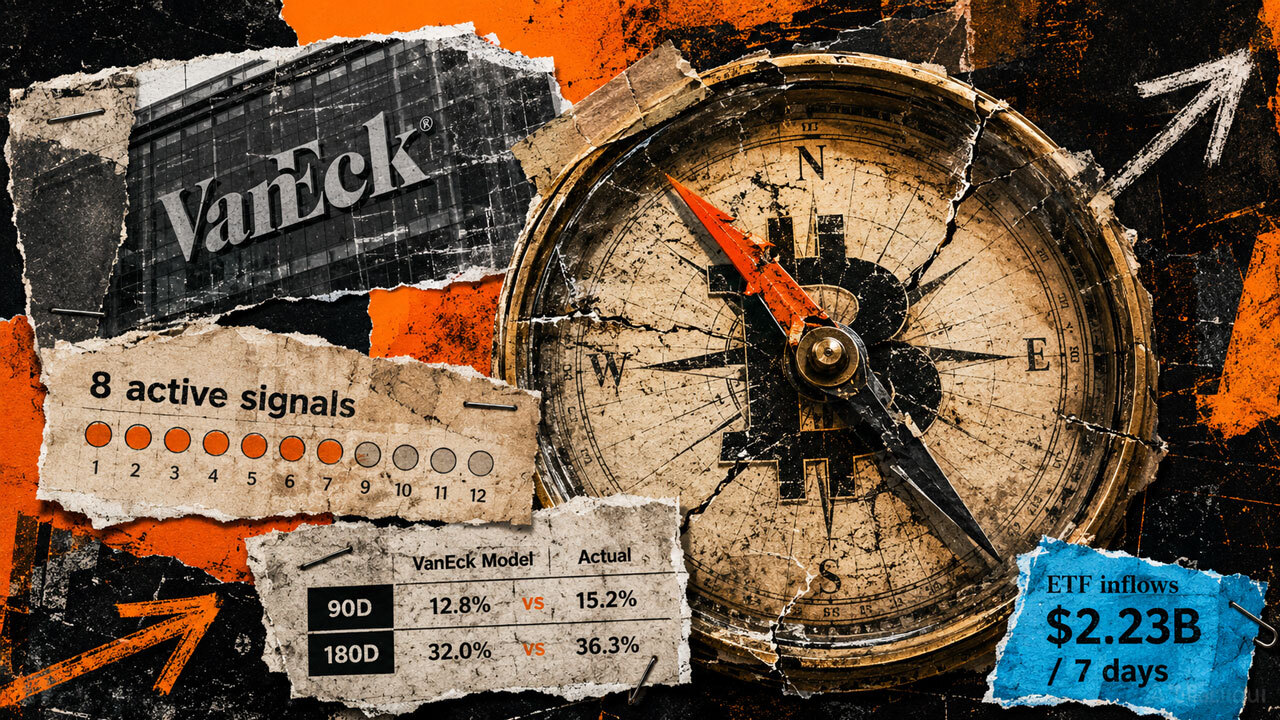
Bitcoin’s bottom signal is flashing, but six months of data shows a trap waiting for early buyers
Bitcoin’s late-August recovery has unfolded in stages. Days prior to the Aug. 19 pump, VanEck’s capitulation dashboard showed broa...

Bitcoin Price Prediction: Can BTC Reclaim $80K This Week?
Bitcoin price prediction has the leading digital asset trading at $79,400, down -0.4% on the day, as the market digests a violent...

Ripple moves to shrink XRP Ledger attack surface as AI audit tests lending push
Ripple is moving to shrink the XRP Ledger’s (XRPL) attack surface as it prepares to expand native lending. The company has recomme...