XRP’s Biggest Holders Just Stopped Sending Tokens to Exchanges: Last Time Was November 2021
XRP is trading above $1.41 as the market enters what feels like a decisive phase — a consolidation that has been building long enough that the next directional move is increasingly difficult to delay. The price is constr...
Archive context
Older archive item. Useful for background and entity history, but not a fresh market-moving signal.

XRP is trading above $1.41 as the market enters what feels like a decisive phase — a consolidation that has been building long enough that the next directional move is increasingly difficult to delay. The price is constructive, and an Arab Chain report tracking whale behavior on Binance has just identified a shift in large holder activity that adds a specific structural dimension to the current setup.
The report begins with the March picture, which serves as the alarming baseline. At the beginning of March, 30-day cumulative whale inflows to Binance reached 2.6 billion XRP — a level of large holder activity that reflected significant movement toward the exchange platform. In on-chain analysis, whale inflows of that scale to centralized exchanges carry a specific implication: when the biggest holders move large amounts to trading platforms, the likelihood of selling or repositioning increases meaningfully. The exchange is where selling happens. Inflows of 2.6 billion XRP from major holders created a supply overhead that the market had to absorb.
That was March. The Arab Chain report’s more significant finding is what has happened since, because the shift from that 2.6 billion baseline to the current reading is the data point that changes how XRP’s current price level should be interpreted.
From 2.6 Billion to 736 Million. The Biggest Sellers Have Nearly Left the Building.The Arab Chain report’s forward signal is contained in the direction and magnitude of what followed the March peak. The 30-day cumulative whale inflow indicator has been declining gradually and steadily since then, reaching approximately 736 million XRP — its lowest reading since November 2021. From 2.6 billion to 736 million in a matter of weeks represents a 72% reduction in the primary channel through which large-scale XRP selling reaches the market.
The report identifies two possible explanations for that behavioral shift, and both carry constructive implications. The first is reduced selling intent — whales are simply less inclined to sell at current levels and are choosing to hold their XRP off-exchange rather than position for distribution. The second is caution and anticipation — major investors are watching the market’s direction carefully before committing to any significant repositioning, which keeps their coins away from exchanges in the meantime.
The continued decline through the volatility of recent weeks adds weight to both interpretations. If whale inflows had been declining simply because markets were quiet, volatility would have reversed them. They kept falling regardless, which suggests the behavioral shift is deliberate rather than circumstantial.
The forward condition the report identifies is specific. If inflows remain at these historically low levels while demand improves and price stabilizes around the current level, XRP has the structural conditions to build a stronger price base. The largest source of selling pressure has retreated. What replaces it on the demand side will determine how durable that base becomes.
XRP Compresses Below Resistance As Range TightensXRP continues to consolidate around the $1.40–$1.42 region, maintaining a tight range after the sharp capitulation event in February. That move reset the broader structure, and since then, the price has transitioned into a prolonged sideways phase marked by reduced volatility and increasingly compressed price action. This type of behavior typically reflects equilibrium between buyers and sellers, but it also tends to precede expansion.
From a structural perspective, XRP remains below all major moving averages. The 50-day is flattening and acting as immediate resistance, while the 100-day and 200-day continue trending downward above price. This alignment confirms that the broader trend has not yet shifted bullish, even as short-term momentum stabilizes.
What has changed is the downside behavior. Selling pressure has clearly weakened, with repeated dips toward the $1.30–$1.35 zone being absorbed consistently. Buyers are stepping in earlier, preventing deeper retracements and forming a subtle sequence of higher lows within the range.
Volume supports the compression narrative. Participation has declined compared to the selloff phase, indicating that the market is waiting for a catalyst rather than actively positioning.
A break above $1.45 would mark the first structural shift toward a recovery. Until then, XRP remains coiled within a tightening range.
Featured image from ChatGPT, chart from TradingView.com
Why this matters
XRP is showing up inside the Layer 2 theme, so this story is worth tracking for follow-through rather than treating it as a one-off headline.
Original source
Read on NewsBTCRelated market context

Crypto Whale Activity: $7.2M Flows Into 9 Altcoins as PUMP and ENA Face Selling Pressure
Crypto whale activity is sending unusual signals across the altcoin market. One whale deployed $7.22 million across nine coins, in...

Mark Zuckerberg Meta AI Predicts an Insane Run for BTC in Q4
Something potentially seismic could be approaching for Bitcoin by January 1, 2027. Mark Zuckerberg’s Meta AI predicts that if a fu...
China Moves to Confiscate $5 Billion in Bitcoin From Fraudster Who Fled to UK: Report
Bitcoin Magazine China Moves to Confiscate $5 Billion in Bitcoin From Fraudster Who Fled to UK: Report Chinese authorities are wor...

Ripple and Arf Bring $10B PayFi Settlement Liquidity to XRP Ledger With RLUSD
Key Takeaways: For licensed payment companies on the XRP Ledger, Arf is rolling out settlement financing using RLUSD. About $10 bi...

Bitcoin Is Busier Than Ever, but Bitcoin Mining Isn’t Getting Paid More
Bitcoin is processing more transactions than ever before on an annual basis, but the growing activity is doing little to improve o...
Bitcoin Price Plunges Below $81K Despite $1 Billion in ETF Inflows
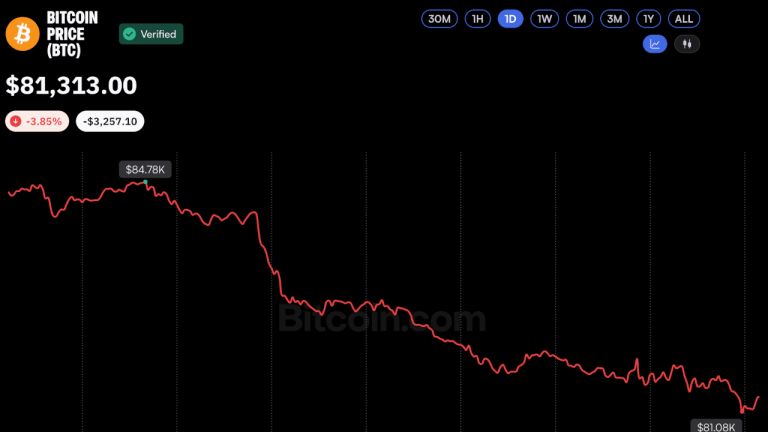
Bitcoin dropped below $82,000 to an intraday low of $80,836 during a late Wednesday sell-off, capping a nearly 4% daily loss and h...