Bitcoin 200-Day Average Signals Waning Bullish Momentum, Here’s What It Means For BTC Price
A key long-term price indicator for Bitcoin, the 200-day simple moving average (SMA) appears to be losing its bullish momentum as the US economy added fewer jobs in August 2024. Bitcoin Must Overcome The 200-Day SMA To R...
Archive context
Older archive item. Useful for background and entity history, but not a fresh market-moving signal.

A key long-term price indicator for Bitcoin, the 200-day simple moving average (SMA) appears to be losing its bullish momentum as the US economy added fewer jobs in August 2024.
Bitcoin Must Overcome The 200-Day SMA To Reverse TrendThe 200-day SMA is considered one of the more reliable long-term indicators to gauge an asset’s upcoming price action. Bitcoin’s 200-day SMA shows a weakening bullish momentum, giving short-term traders little joy.
Notably, this is the first time since October 2023 that the 200-day SMA looks poised to enter bearish territory. Since late August, the daily increase in average price increases for BTC has not crossed $50, while it used to consistently record moves of more than $200 per day during the first half of 2024.
At press time, the 200-day SMA stood at $63,840, about 13.96% higher than the current BTC price of $56,840.
It’s worth highlighting that short-term moving average indicators such as the 50-day SMA and the 100-day SMA are already past their peak and have been trending downward. A bearish crossover was seen recently when the 100-day SMA fell below the 200-day SMA.
According to cryptocurrency analyst Ali Martinez, the Stochastic relative-strength index (RSI) has signaled a trend reversal from bullish to bearish on the Bitcoin 2-month chart. If going by historical data, such a move has typically led to a significant correction of up to 75.50%.
In addition, Google Trends shows that searches for the word “Bitcoin” have been at their lowest since October 2023, when BTC was hovering around $30,000.
Adding to the overall bearish sentiment surrounding the leading digital asset, former CEO of BitMEX cryptocurrency exchange Arthur Hayes posted on X that he’s currently short Bitcoin and could see the crypto-asset crash to sub $50k level over the weekend.
In contrast, other market experts opine that Bitcoin will likely bottom at $55,000 before the influx of US liquidity helps re-ignite the severely lacking buying pressure in the crypto markets.
Bitcoin’s Fundamentals Remain IntactAlthough several crypto analysts seem to lean bearish on Bitcoin’s short-term price movements, the long-term bull case for the leading digital asset remains unchanged.
Crypto analyst Crypto Jelle posits that Bitcoin’s tepid price action during the summer might reach its conclusion by early October before it could potentially resume another rally to the upside.
Institutional interest in Bitcoin also continues to rise, as Swiss banking giant ZKB recently rolled out Bitcoin (BTC) and Ethereum (ETH) trading and custody services for its customers. At press time, BTC trades at $56,018.
Why this matters
This bitcoin story adds another data point to the current market tape and is useful when read alongside nearby source coverage.
Original source
Read on NewsBTCRelated market context
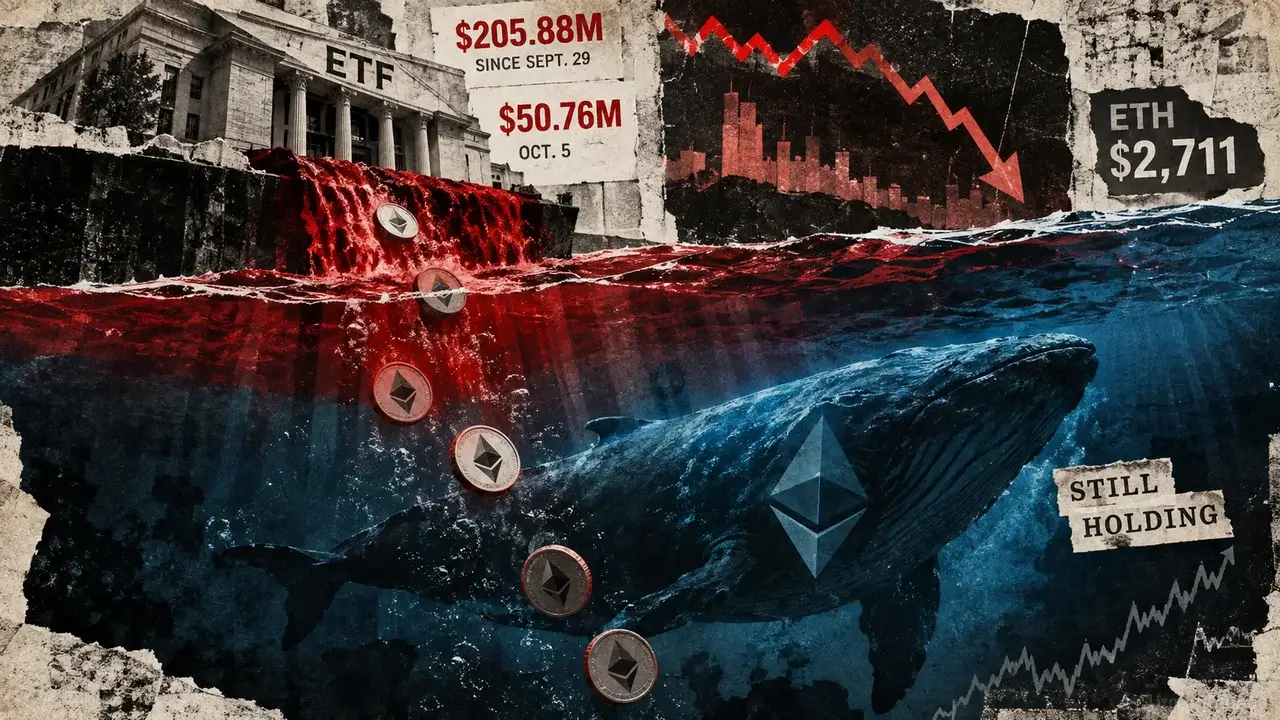
Ethereum bears keep selling but ETH price stays near $2,700 as US spot ETFs record $206M in outflows
Ethereum’s institutional demand is weakening around the same time derivatives positioning shows traders are selling aggressively w...

Non-Custodial Crypto Exchanges: How Self-Custody Is Changing the Way Users Swap Digital Assets
For many users, the distinction comes down to custody. A centralized platform may hold assets on behalf of its customers, while a...

Genius Group Restarts Bitcoin Buying With 10 BTC Purchase
TL;DR Genius Group has restarted Bitcoin purchases, buying 10 BTC for approximately $854,000. The company paid an average of $85,3...

Aave and Pendle may have found a way to keep yield capital from ever leaving DeFi
Aave is approaching a $67 million collateral rollover as one of its fastest-growing fixed-yield trades reaches maturity. About 67....

Bitcoin Price Could Reverse Following Tech Stocks, Peter Schiff Says
Strategy bought 334 BTC for about $28.7 million and repurchased $176 million of STRC in its latest disclosure, even as Peter Schif...

The Real Estate Market Is Dead in Spain. Long Live Bitcoin.
Bitcoin Magazine The Real Estate Market Is Dead in Spain. Long Live Bitcoin. Spain has just shown every property owner in Europe t...