Bitcoin 90-Day CDD Hits All-Time Low, What Does It Say About Market?
Data shows the Bitcoin 90-day Coin Days Destroyed metric has hit an all-time low, here’s what it says about investors in the BTC market. Bitcoin 90-Day CDD Has Recently Plunged To A New All-Time Low As per the latest wee...
Archive context
Older archive item. Useful for background and entity history, but not a fresh market-moving signal.

Data shows the Bitcoin 90-day Coin Days Destroyed metric has hit an all-time low, here’s what it says about investors in the BTC market.
Bitcoin 90-Day CDD Has Recently Plunged To A New All-Time LowAs per the latest weekly report from Glassnode, old BTC supply is more dormant right now than it has ever been during the history of the crypto.
A “coin day” is defined as the amount accumulated by 1 BTC after sitting still for 1 day. The total coin days on the network, therefore, is a measure of how many days all the coins on the network combined have been stationary for, or more simply, how dormant the Bitcoin circulating supply has been.
When any of these coins with some accumulated coin days make some movement, their coin days naturally reset back to zero, and are said to have been “destroyed.”
The “Coin Days Destroyed” (CDD) indicator measures how many coin days are being destroyed in this way every day across the entire BTC network.
Now, here is a chart that shows the trend in the Bitcoin CDD over the history of the crypto:
The value of the metric seems to have gone down in recent days | Source: Glassnode's The Week Onchain - Week 39, 2022As you can see in the above graph, the version of the Bitcoin CDD shown is actually the 90-day one, which measures the total amount of coin days that were destroyed during the last ninety days.
Since the long-term holders accumulate the most number of coin days in the market, spikes in the CDD can mean these older, and generally more resolute holders, have been spending their coins.
The report notes that the 90-day version of the indicator can help us know about periods of high and low selling pressure from these hodlers.
From the graph, it’s apparent that the Bitcoin CDD has recently set a new all-time low, suggesting that old supply is right now the most dormant it has ever been.
This implies that the latest investor behavior in the BTC market has been that of extreme hodling at levels not observed during any of the previous cycles.
BTC PriceAt the time of writing, Bitcoin’s price floats around $20.3k, up 7% in the last week. Over the past month, the crypto has gained 1% in value.
The below chart shows the trend in the price of the coin over the last five days.
Looks like the value of the crypto has surged up over the past twenty-four hours | Source: BTCUSD on TradingView Featured image from Bastian Riccardi on Unsplash.com, charts from TradingView.com, Glassnode.comWhy this matters
This bitcoin story adds another data point to the current market tape and is useful when read alongside nearby source coverage.
Original source
Read on NewsBTCRelated market context

Americans Have Been Paying Less for Bitcoin Than the Rest of the World for 50 Straight Days
Bitcoin has traded at a discount on Coinbase versus Binance for 50 straight days, with the Coinbase Bitcoin Premium Index still ne...

These crypto chains raised $500M but generate just $360 in daily fees
Just a few short years ago, the crypto hype was strong. VCs were eager to pour money into solutions for scalability, data availabi...

US turns stablecoin issuer Tether into a financial weapon against Iran, freezing nearly $500 million
US authorities have used Tether's control over its dollar-linked stablecoin to freeze about $475 million connected to Iran in less...

Tether’s Pact Labs Round Shows Stablecoin Issuers Are Still Building Compliance Rails
Tether’s Pact Labs Round Shows Stablecoin Issuers Are Still Building Compliance Rails is a useful reminder that crypto coverage is...
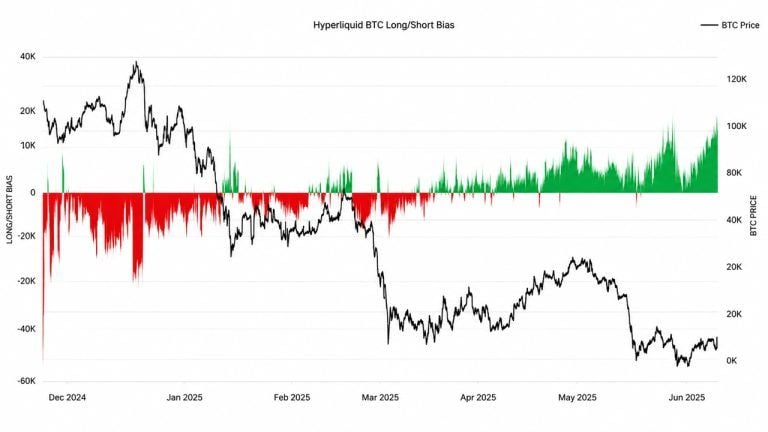
Glassnode: Hyperliquid Bitcoin Longs Just Topped Levels From Q2’s $83K Run
Top traders on Hyperliquid are running some of the most aggressive bitcoin long positioning ever recorded by Glassnode, exceeding...

US and UK Publish Joint Roadmap to Align Rules for Tokenized Assets and Cross-Border Stablecoins
The United States and the United Kingdom unveiled a joint plan on Tuesday to make it easier for tokenized financial products to mo...