Bitcoin Accumulation Notably Weaker Than Nov 2025 Bounce: Glassnode
On-chain analytics firm Glassnode has highlighted how accumulation during the recent Bitcoin drop has looked weaker than some past crashes. Bitcoin Accumulation Trend Score Doesn’t Indicate Strong Accumulation In a new p...
Archive context
Older archive item. Useful for background and entity history, but not a fresh market-moving signal.

On-chain analytics firm Glassnode has highlighted how accumulation during the recent Bitcoin drop has looked weaker than some past crashes.
Bitcoin Accumulation Trend Score Doesn’t Indicate Strong AccumulationIn a new post on X, Glassnode has talked about the latest trend in the Accumulation Trend Score of Bitcoin. This indicator tracks whether the BTC investors are accumulating or distributing right now.
The metric determines this by taking into account for two factors: the balance changes happening in the wallets of the holders and the size of the balances themselves. The latter factor means that larger entities have a higher weightage in the indicator.
When the value of the Accumulation Trend Score is greater than 0.5, it means the large holders (or a large number of small entities) are in a phase of accumulation. The closer is the metric to the 1.0 level, the stronger is this behavior.
On the other hand, the indicator being under the 0.5 mark suggests distribution is dominant on the network. The selling can be considered the strongest at a value of zero.
Now, here is the chart shared by Glassnode that shows the trend in the 7-day moving average (MA) of the Bitcoin Accumulation Trend Score over the last few years:
As displayed in the above graph, the Bitcoin Accumulation Trend Score took a yellow shade as the cryptocurrency’s January recovery rally topped out and a move downward followed. This suggests that the investors were distributing.
As the coin has stabilized above $65,000 recently, the indicator’s color has changed to a darker one, implying it has broken back above the 0.5 mark. While this is a sign that there has been some accumulation at the post-crash price levels, the degree of it hasn’t been too high.
From the chart, it’s apparent that this behavior is in contrast to how the market reacted to the November crash. Back then, the Accumulation Trend Score took a deep purple shade, indicating an aggressive amount of accumulation from the big-money hands.
The LUNA and FTX crashes from the 2022 bear market were also met with a similarly extreme accumulation behavior. It now remains to be seen whether the lack of demand this time around will mean that Bitcoin will take some time to settle into a low.
In some other news, Glassnode has shared an update in an X post on how the major Bitcoin on-chain price models are looking.
As is visible in the graph, Bitcoin’s decline has meant that its price is now trading under all major on-chain pricing models except for the Realized Price, corresponding to the cost basis of the network participants as a whole. This level is currently located at $54,900.
BTC PriceBitcoin has stagnated since its recovery from the $60,000 low as its price is still floating around the $68,000 level.
Why this matters
Bitcoin is a tracked market entity in the DigitalMoneyBox archive, making this useful context for readers monitoring repeated mentions and follow-up coverage.
Original source
Read on NewsBTCRelated market context

XRP Price Today: XRP Reclaims $1.40 as Whale Accumulation Hits $2.2B
Santiment-linked data cited by crypto analyst Ali Martinez shows large holders accumulated approximately 1.54 billion XRP, worth a...

Bitcoin (BTC) Price Today: BTC Breaks $85K Resistance as Bulls Defend $80K Support
BTC traded around $85,311 in the technical analysis referenced for this report, while the broader market move also lifted Bitcoin...

Dogecoin (DOGE) Price Prediction: Ichimoku Breakout and Whale Buying Set the Stage for a Move Towards $0.10
The latest recovery has not yet confirmed a broader bullish reversal. However, several on-chain and technical indicators suggest t...
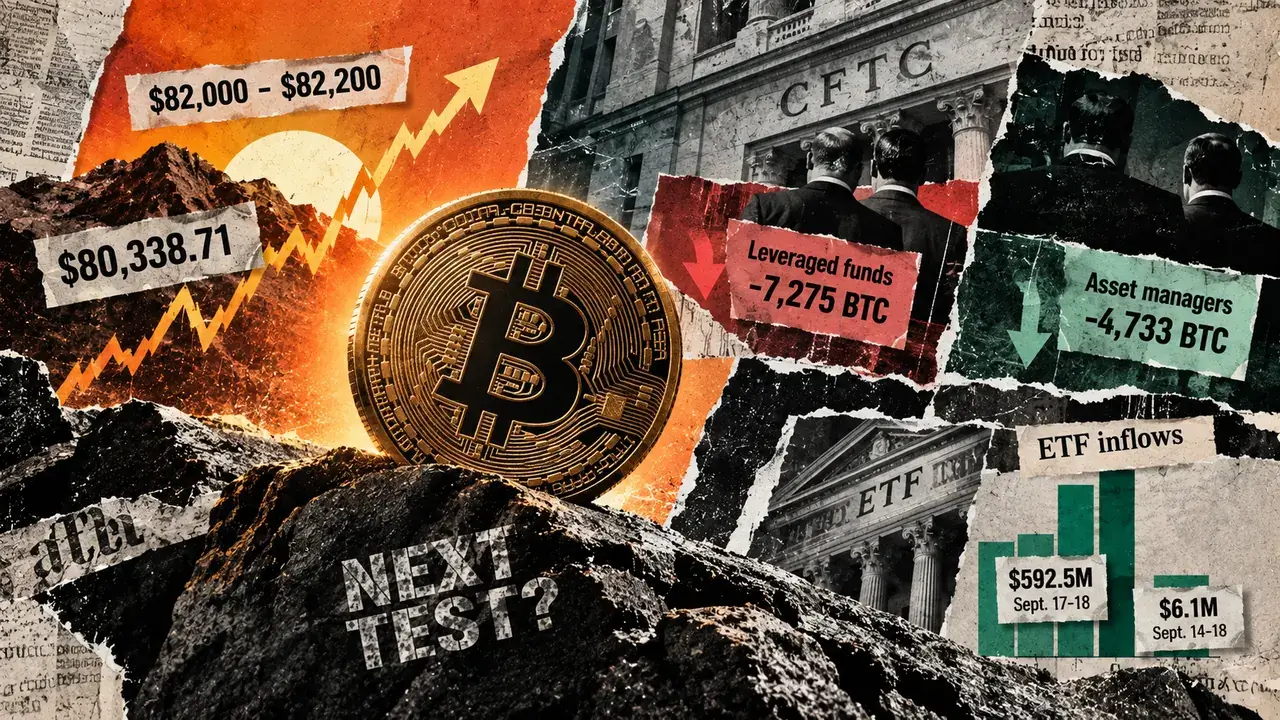
Why Bitcoin’s rally above $80,000 isn’t backed by institutional conviction
Bitcoin held above $80,000 this weekend while three institutional indicators pointed in different directions. The Sept. 15 snapsho...

Glassnode reports shift from Bitcoin to altcoin season amid broader rally
The shift to altcoin season suggests a diversification trend, but low leverage indicates cautious market sentiment and potential v...

Perplexity AI Predicts Weak XRP Price by 2027: Bull Run Canceled?
The Silicon Valley-based Perplexity AI predicts XRP could have a tame Q4, saying it believes the token will only hit $3.25 by Janu...