Bitcoin Breaks Above STH Realized Price For The First Time In Weeks – What’s Next?
Bitcoin is showing early signs of strength as it attempts to reclaim the $115,000 level. After weeks of mixed sentiment and heavy selling pressure, momentum appears to be turning slightly bullish. The recent weekly close...
Archive context
Older archive item. Useful for background and entity history, but not a fresh market-moving signal.

Bitcoin is showing early signs of strength as it attempts to reclaim the $115,000 level. After weeks of mixed sentiment and heavy selling pressure, momentum appears to be turning slightly bullish. The recent weekly close above $114,500 has confirmed a reclaim of the Short-Term Holder (STH) Realized Price, a key on-chain threshold currently sitting near $113,000. This metric represents the average cost basis of recent market participants and often serves as a pivotal line separating bullish from bearish sentiment.
Top analyst Darkfost shared that this reclaim is an encouraging signal, reflecting renewed buyer confidence after a volatile October. However, he also cautioned that Bitcoin’s position must still be monitored closely. A rejection at current levels could lead to a renewed correction phase, mirroring the pattern seen in 2024, when BTC faced multiple failed attempts before regaining upward momentum.
For now, the market sits at a delicate crossroads — consolidating below resistance while holding critical on-chain support. If Bitcoin can sustain this structure and push convincingly above $115K, analysts believe it could open the door for a broader bullish continuation and potentially a retest of the $120K region in the weeks ahead.
Bitcoin Holds Above Key On-Chain LevelAccording to top analyst Darkfost, Bitcoin’s reclaim of the Short-Term Holder (STH) Realized Price around $113,000 could mark a crucial turning point for market structure. He notes that during the 2024 correction, BTC faced four failed attempts to break above this same metric. Each rejection was driven by short-term holders selling at their break-even points — a typical psychological reaction that delays trend reversals. Once Bitcoin finally sustained above the STH Realized Price, however, the market quickly regained momentum and entered a new expansion phase.
This time, the dynamic appears similar. If Bitcoin successfully consolidates above this zone, it could pave the way for a strong bullish impulse and potentially a new all-time high (ATH) in the short term. The STH Realized Price acts as a measure of conviction among recent investors; holding above it suggests growing confidence and a shift from capitulation to accumulation.
Darkfost also highlights another critical observation: throughout the current bull cycle, Bitcoin has never fallen below the yearly STH Realized Price. Each time the price neared that level, a rebound followed — reaffirming it as a structural support for the broader trend.
Still, caution remains essential. A breakdown below the $94,000 mark — the current yearly STH Realized Price — would likely signal a deeper market shift. Such a move could mark the transition from a mid-cycle correction into a more prolonged bearish phase.
For now, the data suggests resilience, not weakness. As long as BTC remains above its short-term realized threshold, the broader uptrend remains intact — with potential for the next major rally if buying pressure continues to build above $115K.
BTC Bulls Defend Key Support While Momentum CoolsBitcoin is currently trading around $114,360, consolidating after a brief rally that tested resistance near $115,800–$117,500. The chart shows that BTC successfully reclaimed the 200-period moving average (red line) on the 4-hour timeframe, a level that had acted as resistance throughout mid-October. This reclaim is an encouraging short-term signal, but momentum appears to be slowing as traders await the next catalyst.
The $113,000–$114,000 range now serves as immediate support — aligning with the Short-Term Holder (STH) Realized Price, a key on-chain level that reflects the cost basis of recent buyers. Holding this zone could allow bulls to consolidate strength before another attempt at breaking above $117,500, the main horizontal resistance that capped previous rallies.
On the downside, failure to maintain above the 200-MA could trigger a retest of $111,000, where the 100-MA (green line) provides secondary support. Trading volume remains subdued, reflecting investor caution ahead of the Federal Reserve’s interest rate decision later this week.
Bitcoin remains in a constructive phase as long as it holds above $113K. Sustained consolidation above this level would reinforce bullish structure — while a decisive break above $117,500 could open the path toward $120,000+ in the short term.
Featured image from ChatGPT, chart from TradingView.com
Why this matters
This bitcoin story adds another data point to the current market tape and is useful when read alongside nearby source coverage.
Original source
Read on NewsBTCRelated market context

ETH USD Loses Ground as Ethereum Price Analysis Remains Targeting $3,000 This Week
Ethereum Price Prediction, September 23: Ethereum (ETH) trades at $2,735, down a marginal 0.61% over the past 24 hours, a pause, n...

XRP Price Today: XRP Hits $1.60 as Heavy Whale Accumulation Points to a $2 Rally and Beyond
The XRP price reached $1.6060 on September 23 after opening near $1.5808, according to historical market data. The token subsequen...

Solana Price Prediction: Golden Cross and $2.97B Open Interest Put $400 Target in Focus
Solana price is trading near $117.38 after recovering strongly from its recent lows. With SOL now testing the crucial $118–$120 re...
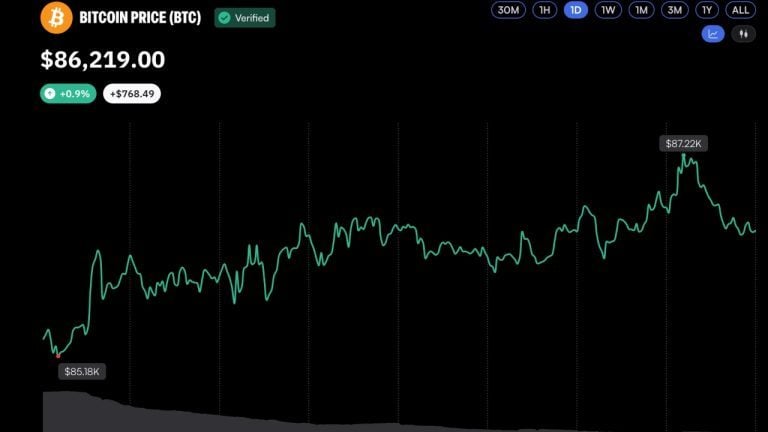
Bitcoin Reclaims $87K as Bull Market Momentum Builds
Bitcoin briefly reclaimed the $87,000 level for the second time in 48 hours, peaking at $87,251 before pulling back to around $86,...

Massive ETF capital exits threaten Bitcoin’s fragile $86,000 price surge
Bitcoin’s 11.65% weekly rebound now carries evidence of genuine spot and on-chain participation, widening a move that began with h...

Can Ripple Crack $1.80? XRP Price Prediction Says This Week
XRP Price Prediction: Ripple (XRP) trades at $1.59 as of this writing, up 1.6% on the day, with a 24-hour range spanning $1.5577 t...