Bitcoin Breaks Down Again — Bearish Momentum Intensifies Across Crypto Market
Bitcoin price is again declining below $110,000. BTC could continue to move down if it stays below the $110,000 resistance. Bitcoin started a fresh decline below the $109,500 support. The price is trading below $109,000...
Archive context
Older archive item. Useful for background and entity history, but not a fresh market-moving signal.

Bitcoin price is again declining below $110,000. BTC could continue to move down if it stays below the $110,000 resistance.
- Bitcoin started a fresh decline below the $109,500 support.
- The price is trading below $109,000 and the 100 hourly Simple moving average.
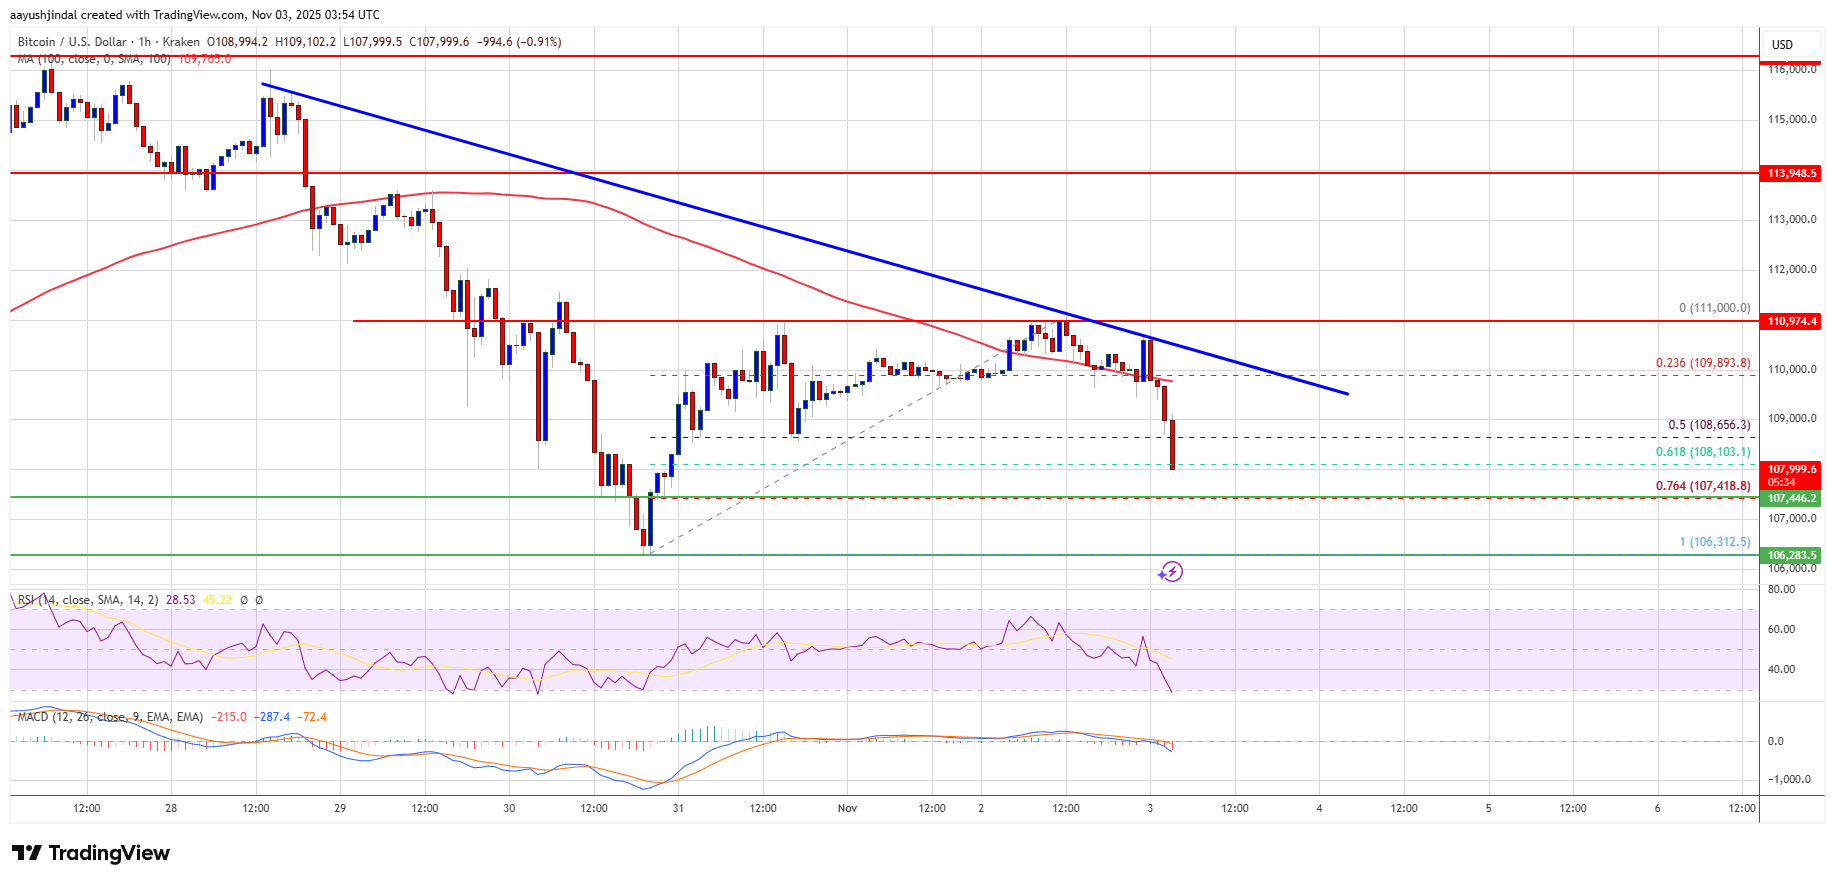
- There is a bearish trend line forming with resistance at $109,800 on the hourly chart of the BTC/USD pair (data feed from Kraken).
- The pair might continue to move down if it trades below the $107,400 zone.
Bitcoin price failed to stay above the $110,500 pivot level and started a fresh decline. BTC dipped below $110,000 and $109,500 to enter a bearish zone.
The decline was such that the price traded below the 50% Fib retracement level of the upward move from the $106,312 swing low to the $111,000 high. Besides, there is a bearish trend line forming with resistance at $109,800 on the hourly chart of the BTC/USD pair.
Bitcoin is now trading below $109,000 and the 100 hourly Simple moving average. If the bulls attempt a fresh increase, the price could face resistance near the $109,500 level. The first key resistance is near the $109,800 level and the trend line.
The next resistance could be $110,500. A close above the $110,500 resistance might send the price further higher. In the stated case, the price could rise and test the $111,200 resistance. Any more gains might send the price toward the $113,500 level. The next barrier for the bulls could be $115,000 and $115,500.
More Losses In BTC?If Bitcoin fails to rise above the $109,800 resistance zone, it could continue to move down. Immediate support is near the $107,400 level or the 76.4% Fib retracement level of the upward move from the $106,312 swing low to the $111,000 high. The first major support is near the $106,500 level.
The next support is now near the $105,500 zone. Any more losses might send the price toward the $104,200 support in the near term. The main support sits at $103,500, below which BTC might struggle to recover in the short term.
Technical indicators:
Hourly MACD – The MACD is now gaining pace in the bearish zone.
Hourly RSI (Relative Strength Index) – The RSI for BTC/USD is now below the 50 level.
Major Support Levels – $107,400, followed by $106,500.
Major Resistance Levels – $109,800 and $110,500.
Why this matters
This bitcoin story adds another data point to the current market tape and is useful when read alongside nearby source coverage.
Original source
Read on NewsBTCRelated market context

Bitcoin (BTC) Price Prediction: BTC Holds $63K Support—Can Rising Active Addresses Offset Bearish Technical Signals?
Although the BTC price has remained near a key support zone, recent chart signals and Strategy’s sale of a portion of its Bitcoin...

Bitcoin price rebounds to $63K as leverage returns creating short term volatility risk
Bitcoin's rebound has cleared the first test: price recovered. The harder one starts now: proving buyers remain after the squeeze....

Bitcoin dominance hits one-month low as altcoin winners start breaking away
Bitcoin's dominance dropped to a one-month low of 54%, down from 58.12%, according to CoinGecko's dominance table. Over the same s...

Strategy Sells 3,588 Bitcoin to Fund Dividends as Saylor’s Treasury Model Meets Its First Real Test
Strategy (MSTR), the Michael Saylor–led company that turned corporate bitcoin accumulation into a Wall Street phenomenon, disclose...

Sui DeFi TVL Breaks $1 Billion As Move-Based Chains Fight For Liquidity
Sui has crossed the $1 billion total value locked mark on DeFiLlama, giving the Move-based network a clearer claim to serious DeFi...

Bitcoin miner bottom signal now depends on who survives weak mining profits
A Bitcoin miner-stress signal circulating on X has fallen into a zone analysts associate with severe miner pressure, putting a fam...