Bitcoin (BTC) Price Prediction: $66,400 Breakout Could End Months of Range-Bound Trading
The market’s next major directional signal could come from a break of the $62,200-$66,400 range, as Bitcoin continues to consolidate below a multi-month descending trendline. The setup is developing at a time when market...
Archive context
Older archive item. Useful for background and entity history, but not a fresh market-moving signal.

The market’s next major directional signal could come from a break of the $62,200-$66,400 range, as Bitcoin continues to consolidate below a multi-month descending trendline.
The setup is developing at a time when market positioning has become more complicated. Bitcoin outperformed major traditional assets on August 17, but its three-month performance relative to equities remains historically weak. At the same time, exchange balances have recovered sharply, and derivatives funding has turned strongly positive.
Together, these factors leave the current Bitcoin price prediction dependent less on a single bullish or bearish indicator and more on whether BTC can establish a sustained breakout above resistance.
Bitcoin Price Remains Locked Inside a Wide RangeBTC/USD has spent much of July and August moving between approximately $62,200 and $66,400. The range has produced several clear reactions at both boundaries without a decisive breakout.
BTC/USD remains range-bound between $62,200 and $66,400, keeping the medium-term outlook neutral amid the absence of a confirmed breakout. Source: NouzTrader on TradingView
Bitcoin reached about $66,400 on July 21-22 before retreating toward the $62,600-$62,800 region. A subsequent rebound pushed the price back to roughly $65,400 on July 29, but another decline followed, taking BTC toward $62,400 between August 2 and 4.
This repeated behavior has created a classic sideways structure. When BTC approaches $65,000 or higher, selling pressure has emerged. Conversely, moves toward $62,200-$62,800 have attracted buyers.
The latest rebound followed the same pattern. BTC climbed from around $62,600 to approximately $64,400, showing that demand remains present near the bottom of the range. However, the recovery has not yet carried the Bitcoin price back to the upper boundary.
For now, the medium-term structure remains neutral rather than decisively bullish or bearish.
$66,400 Is the Key Breakout LevelThe upper boundary of the range is important because it coincides with the latest major swing high. A decisive move above $66,400 would take BTC beyond the resistance that has contained price throughout the recent consolidation.
Bitcoin (BTC) price chart. Source: Brave New Coin
That would also provide an initial indication that the prevailing range is breaking rather than simply producing another temporary rebound.
The nearer resistance area is between $65,000 and $65,400. Clearing this zone would put Bitcoin closer to the more important $66,400 barrier.
On the other hand, failure to hold above $63,200 would weaken the latest short-term recovery. A move back below $62,600 would reinforce the range-bound structure and put the lower boundary around $62,200 back into focus.
A sustained breakdown below $62,200 would provide the clearest bearish confirmation of the current setup.
Bitcoin Technical Analysis Shows a Broader DowntrendA separate weekly analysis places BTC in a somewhat wider consolidation range between approximately $57,735 and $65,771.
Bitcoin closed the week of August 16 around $62,832, according to the TradingView analysis. The price remains below a descending trendline drawn from previous swing highs, which has repeatedly capped recovery attempts.
BTC remains below a multi-month descending trendline, while an RSI below 40 signals weak momentum behind recent rebound attempts. Source: Chartrick on TradingView
The distinction is important. A market can trade sideways for weeks while still remaining inside a larger downtrend. Until Bitcoin reclaims the descending trendline, the current structure is better described as consolidation within a broader corrective phase rather than a confirmed trend reversal.
The most important weekly resistance is around $65,771, where the descending trendline currently intersects the price.
Above that level, the analysis identifies the Bollinger Band midpoint at $69,061 as the next major reference point, followed by the 0.236 Fibonacci retracement near $73,909.
On the downside, immediate support sits around $59,930. The broader levels are $57,735 and $54,866.
RSI Remains Below 40Technical indicators continue to show limited bullish conviction.
The weekly 14-period Relative Strength Index stands at 38.8. The indicator remains below the 40 level that has separated stronger rebounds from weaker recovery attempts during the current downtrend.
Bitcoin is also trading well below the middle Bollinger Band at $69,061. This reinforces the corrective nature of the broader structure.
Volume provides another important piece of context. The analysis identifies a large exhaustion-volume spike from early February as the standout reading on the chart. However, that surge has not yet been confirmed as the beginning of a durable accumulation base.
This combination suggests that sellers may have lost some of their earlier intensity, but buyers have not yet demonstrated enough strength to establish a new sustained uptrend.
Bitcoin Outperformed Stocks on August 17Bitcoin’s short-term performance has recently improved relative to traditional markets.
Glassnode data highlighted a 2.3% gain for BTC on August 17, while the S&P 500 declined 0.4%. The Euro Stoxx 50 also fell 0.2%, while gold gained 0.9%.
BTC gained 2.3% on August 17, outperforming the S&P 500, Euro Stoxx 50, and gold. Source: Glassnode via X
The one-day performance was notable because BTC has struggled to outperform equities over a longer period.
According to the same analysis, BTC outperformed the S&P 500 on only about 33% of trading days during the previous three months. Glassnode described the period as Bitcoin’s longest stretch of underperformance relative to stocks in six years.
That does not determine where the Bitcoin price will move next, but it provides useful context. The latest rebound represents an improvement in relative performance, although it is too early to determine whether it marks a lasting change.
Bitcoin Exchange Balances RecoverOn-chain data provide another potential source of market pressure.
Santiment reported that Bitcoin balances held on exchanges climbed to approximately 1.332 million BTC by August 16, the highest level since June 15. The increase largely reversed the supply decline seen during June and July.
Bitcoin exchange balances rose to approximately 1.332 million BTC by August 16, nearly reversing the June-July outflow of around 33,000 BTC. Source: @SantimentData via X
Exchange balances had fallen from approximately 1.337 million BTC on June 12 to around 1.304 million BTC on July 28. That represented an outflow of roughly 33,000 BTC over six weeks.
The subsequent recovery was much faster. About 28,000 BTC returned to exchanges in less than three weeks, reversing roughly 84% of the earlier decline.
Santiment noted that exchange balances can rise even while Bitcoin ETFs record inflows because ETF creations may source coins through over-the-counter desks and existing holders rather than directly from exchange wallets.
The recovery in exchange-held supply therefore does not automatically mean investors are preparing to sell. It does, however, weaken the argument that visible exchange supply is becoming increasingly scarce.
Bitcoin Funding Rates Signal Stronger Long PositioningDerivatives data add another layer to the current Bitcoin price forecast.
CryptoQuant’s analysis shows funding rates have moved sharply higher after spending much of February through May in negative territory. The latest readings represent a significant shift toward positive derivatives positioning.
Bitcoin funding rates climbed to a 20-month high, signaling renewed bullish positioning and a growing preference for long trades in the derivatives market. Source: @cryptoquant_com via X
Positive funding means traders holding long perpetual futures positions are paying those holding shorts. This generally indicates that bullish positioning has become more dominant.
That can support price momentum when spot demand is strong. However, persistently elevated positive funding can also leave the market vulnerable to volatility if too many traders become positioned in the same direction.
In the current environment, where BTC remains below major resistance, the elevated cost of maintaining long positions is worth monitoring. If BTC breaks higher, those positions could reinforce the move. If the market turns lower, crowded longs could instead increase liquidation pressure.
Bitcoin Price Prediction: What the Levels SuggestThe immediate Bitcoin price prediction remains closely tied to the established range.
A move through $65,000-$65,400 would bring the $65,771-$66,400 resistance cluster into focus. A decisive daily or weekly breakout above $66,400 would be a more meaningful technical development because it would remove the upper boundary that has repeatedly rejected BTC since July.
Above the $65,771 trendline, the next technical reference is $69,061, followed by $73,909.
Conversely, losing $63,200 would weaken the current short-term recovery. A break below $62,600 would strengthen the case for another move toward $62,200. The wider weekly support levels remain $59,930, $57,735, and $54,866.
These levels should be viewed as areas where market behavior may change, rather than predetermined price targets.
What Could End the Bitcoin Range?Bitcoin has now spent weeks oscillating between established support and resistance. The repeated reactions show that both buyers and sellers remain active, but neither side has yet produced enough pressure to force a sustained breakout.
The bullish case would become technically stronger if BTC clears $65,771 and then breaks $66,400 with sustained trading above the range. Such a move would also place Bitcoin above the descending trendline identified on the weekly chart.
The bearish alternative would emerge if BTC loses $62,200. That would invalidate the current range and expose the lower weekly support levels.
Between those boundaries, the market remains in consolidation.
For now, the latest Bitcoin price action shows a market attempting to recover from range support while still facing a significant technical ceiling. Improving one-day performance, rising exchange balances, and elevated funding rates each tell a different part of the story. None independently confirms the next major trend.
The clearest signal remains price itself. A sustained break above $66,400 would provide evidence that the months-long range is giving way to a new phase, while a break below $62,200 would point in the opposite direction. Until either occurs, BTC remains caught between established support and resistance, with traders waiting for confirmation rather than a definitive trend.
Why this matters
Bitcoin is showing up inside the Market Structure theme, so this story is worth tracking for follow-through rather than treating it as a one-off headline.
Original source
Read on Brave New CoinRelated market context

Why Is XRP Down Today? Bears Target $1.30 Support as Selling Pressure Builds
The downturn has weakened XRP’s short-term technical structure, leaving traders focused on whether buyers can defend nearby suppor...

Ethereum Price Prediction: ETH Outpaces the Market as Crypto Rebounds
Ethereum is outperforming the crypto market, rising by almost 3% over the past 24 hours to just a notch under $2,500 as digital as...

Bitcoin Price Prediction: Bitcoin Tracks Treasury Real Rates, Fidelity Finds
Bitcoin is trading at $82,000, rebounding from $80,000 since yesterday morning, as traders weigh a new macro signal that could fli...

Most net-long XRP positions sit above the current price, leaving traders underwater
High long exposure and potential liquidations could exacerbate XRP's price volatility, impacting market stability and trader confi...
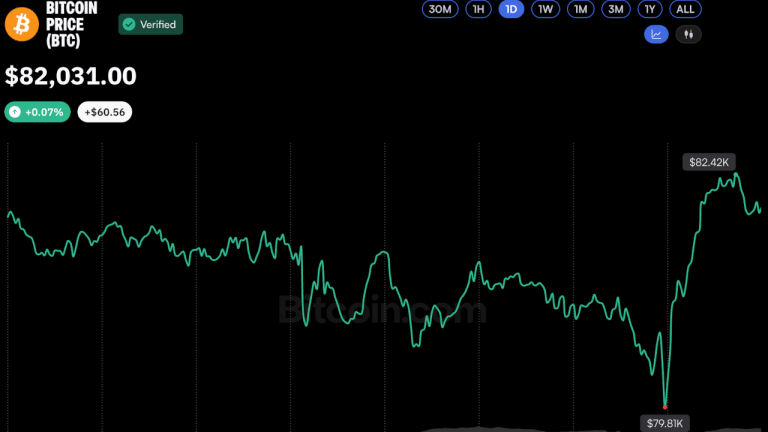
Bitcoin Price Rebounds Above $82K After Brief Dip Below $80K
Bitcoin staged a rapid recovery Thursday, climbing back above $82,000 to trade slightly higher over 24 hours with a market cap nea...

XRP Price Prediction: XRP Duo Turn Bullish, $1,000 Dream Lives On
XRP is trading at $1.34, up more than 1% after a brutal Wednesday. Ripple CEO Brad Garlinghouse says XRP has legal clarity despite...