Bitcoin (BTC) Price Today: Whale Selling and ETF Outflows Put $76K Support to the Test
The Bitcoin price remains within a broader range, however, with technical support between $76,000 and $77,500 continuing to attract buyers. The latest data presents a mixed picture for Bitcoin price today. Glassnode iden...
Archive context
Older archive item. Useful for background and entity history, but not a fresh market-moving signal.

The Bitcoin price remains within a broader range, however, with technical support between $76,000 and $77,500 continuing to attract buyers.
The latest data presents a mixed picture for Bitcoin price today. Glassnode identified substantial selling across spot and perpetual markets, while Santiment found that larger Bitcoin holders have been reducing exposure as smaller wallets continue accumulating. At the same time, a TradingView analysis shows BTC recently defending the $76,000-$77,500 demand zone.
Bitcoin Price Holds Range Despite Selling PressureBitcoin has remained close to $78,000 after retreating from a recent local high near $82,261. The decline has not yet resulted in a decisive breakdown, leaving the broader market structure range-bound rather than clearly bearish.
BTC Realized Cap Change chart. Source: Glassnode via X
Glassnode’s September 14 analysis showed that selling pressure has become visible across both spot and derivatives markets. Spot cumulative volume delta (CVD) was around negative $143 million, while perpetual futures CVD stood near negative $606 million.
CVD measures the difference between aggressive buying and selling. Negative readings indicate that market participants executing trades at the bid have been more dominant than those lifting offers. In the current environment, that suggests sellers have maintained the upper hand across both major segments.
Bitcoin Perpetual CVD chart. Source: Glassnode via X
The weakness also extends to institutional flows. Glassnode’s data showed weekly U.S. spot Bitcoin ETF netflows turning negative, with the latest reading around negative $467 million. Its ETF dataset tracks flows across products including BlackRock’s IBIT, Fidelity’s FBTC, Grayscale’s GBTC, and other U.S. spot Bitcoin funds.
Bitcoin ETF Netflow (weekly) chart. Source: Glassnode via X
That change matters because spot ETFs have become an important channel through which traditional investors gain exposure to Bitcoin. Persistent outflows can therefore remove a source of demand at a time when the market is already dealing with weaker spot activity.
Still, Glassnode’s assessment does not point to an established structural breakdown. The firm highlighted continued capital inflows into the broader Bitcoin market and relatively high holder profitability as factors helping absorb the selling.
Whale Distribution Raises CautionSantiment’s holder distribution data provides another reason for caution. According to the analysis, wallets holding between 10 and 10,000 BTC reduced their holdings by 0.20% over three weeks while Bitcoin remained above $80,000.
Santiment data shows large BTC holders reduced their holdings by 0.20%, while retail wallets increased theirs by 0.09% during Bitcoin’s period above $80K. Source: Santiment via X
Smaller wallets moved in the opposite direction. Addresses holding less than 0.01 BTC increased their holdings by 0.09% during the same period.
The divergence suggests that some larger market participants were reducing exposure while smaller holders were adding during the earlier price advance. Santiment has highlighted similar differences between larger and smaller wallet groups when assessing periods of elevated market enthusiasm.
Santiment’s methodology allows Bitcoin supply to be examined across specific wallet-balance ranges, making it possible to track changes in ownership concentration among different classes of holders.
The current pattern does not establish that whales are responsible for the recent decline. However, the combination of larger-holder distribution and retail accumulation is relevant when assessing the strength of the latest BTC price move.
If larger holders continue reducing balances while smaller investors keep buying into weakness, demand may need to strengthen elsewhere to prevent additional pressure on the market.
Spot Demand Remains a Key WeaknessCryptoQuant has also pointed to a gap between derivatives activity and the underlying spot market.
Its 30-day demand growth data indicates that futures demand has moved into positive territory while spot demand remains negative. Total demand is still contracting, according to the analysis.
CryptoQuant says Bitcoin’s latest rally lacks conviction as weak spot demand leaves the move increasingly reliant on perpetual futures activity. Source: CryptoQuant via X
This distinction is important because a rally supported primarily by perpetual futures activity can have a different market structure from one accompanied by sustained spot purchases. Derivatives can amplify price movements through leverage, while spot buying represents direct purchases of the underlying asset.
CryptoQuant’s broader market data infrastructure tracks spot, derivatives, funding, open interest, and other Bitcoin indicators across major venues.
The present setup therefore leaves the Bitcoin price forecast dependent partly on whether spot demand can recover. A sustained improvement in spot buying would provide stronger confirmation that the market is absorbing existing supply rather than simply experiencing another derivatives-driven move.
BTC Price Tests Key Demand ZoneTechnical analysis provides a more constructive counterpoint to the weak flow data.
According to a TradingView analysis by NouzTrader, BTC recently moved into the $76,000-$77,500 demand zone after declining from the $82,261 area. The analysis noted a bullish rejection around $77,394, with several preceding candles showing long lower wicks between roughly $76,200 and $76,500.
The H4 chart remains in a bullish consolidation pattern, with BTC forming a local high near $82,261 before pulling back into the $76,000-$77,500 demand zone. Source: NouzTrader on TradingView
Those formations indicate that buyers have repeatedly responded around the lower part of the range. They do not guarantee a reversal, but they show that selling has so far failed to produce a sustained break beneath the zone.
The next resistance area sits between $79,500 and $80,400. Above that, the $82,000-$82,261 region becomes the key barrier, with the latter marking the recent local high.
A sustained move above $80,400 would therefore improve the near-term technical picture. A break through $82,261 would provide stronger evidence that the recent consolidation is resolving to the upside.
Conversely, a clear daily or H4 breakdown below $76,000 would weaken the current rebound structure. The next historical demand area identified in the analysis sits around $72,000-$72,800.
Bitcoin Price Prediction: $76K Support Holds KeyThe immediate Bitcoin price prediction remains closely tied to the reaction around $76,000-$77,500.
The technical setup shows buyers defending the zone, while on-chain and market-flow indicators point to weaker demand. Neither side has yet produced enough evidence to establish a decisive new trend.
Bitcoin (BTC) price chart. Source: Brave New Coin
NouzTrader’s Elliott Wave interpretation considers the decline from $82,261 to the $76,000-$77,500 area a corrective Wave 4 move, with a potential Wave 5 advance developing if support continues to hold. Under that framework, $79,500-$80,400 becomes the first upside area to monitor, followed by the previous high near $82,261.
That projection remains a technical scenario rather than a confirmed outcome. The broader data warrants caution because spot selling, ETF redemptions, and whale distribution can limit the strength of any rebound.
For BTC today, the most important development may therefore be less about a specific upside target and more about whether Bitcoin can establish sustained demand above the $76,000 floor.
What to Watch Next for BTCBitcoin’s current structure leaves several levels and indicators in focus.
A sustained defense of $76,000-$77,500 would keep the existing range intact and could allow BTC to retest $79,500-$80,400. A move beyond that resistance would put $82,261 back into focus.
On the other hand, a decisive loss of $76,000 could expose the $72,000-$72,800 region. Such a move would also weaken the bullish consolidation structure highlighted by the H4 analysis.
Beyond price levels, the recovery of spot demand will be important. A shift from negative to positive spot demand, alongside improving ETF flows, would provide stronger evidence of genuine buying interest. Conversely, continued ETF outflows and negative spot CVD could make it harder for BTC to sustain a recovery.
For now, the Bitcoin latest price structure remains under pressure without confirmed structural failure. Bitcoin is holding above a key demand zone, but the flow data shows that buyers have yet to demonstrate enough conviction to dismiss the risks surrounding the current consolidation.
Why this matters
Bitcoin is showing up inside the Bitcoin ETF theme, so this story is worth tracking for follow-through rather than treating it as a one-off headline.
Original source
Read on Brave New CoinRelated market context
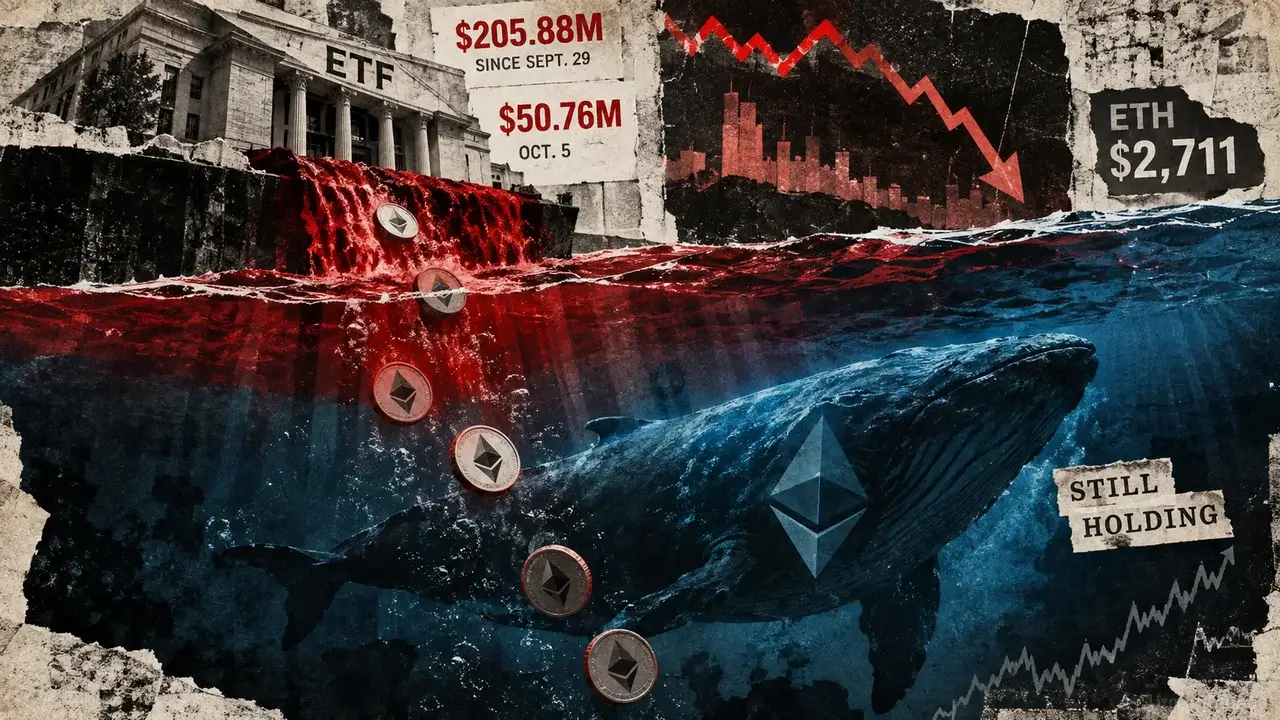
Ethereum bears keep selling but ETH price stays near $2,700 as US spot ETFs record $206M in outflows
Ethereum’s institutional demand is weakening around the same time derivatives positioning shows traders are selling aggressively w...

BlackRock Says AI Agents Could Be the Next Big Driver of Crypto Demand
Bitcoin Magazine BlackRock Says AI Agents Could Be the Next Big Driver of Crypto Demand Artificial intelligence and digital assets...

Winklevoss Zcash ETF Could Become the Second U.S. Spot ZEC Fund After Grayscale’s ZCSH
Winklevoss Asset Services, the fund sponsor run by chief executive Cameron Winklevoss, filed a registration statement with the SEC...

TOKEN2049 Singapore Schedule Puts Institutional DeFi on the 2026 Agenda
TOKEN2049 Singapore is scheduled for October 7–8, 2026, with confirmed speakers from Nasdaq, BlackRock, and Franklin Templeton app...

Hyperscale Data Says Bitcoin And Cash Reserves Reach $56.4M
TL;DR Hyperscale Data says it held about $56.4 million in Bitcoin, cash and restricted cash as of October 4. That total included 2...

Centrifuge flags transparency gap as only 29.2% of tokenized assets show verifiable onchain data
The transparency gap in tokenized assets could hinder institutional adoption and risk management, impacting the broader DeFi ecosy...