Bitcoin bulls should 'be careful with longs' as BTC price risks $100K breakdown
Key takeaways:Bitcoin dropped over 4.5% on May 19, confirming a bearish divergence and threatening a break below $100,000.Analysts highlight $97,000–$98,500 as key support that the bulls must hold. A potential inverse he...
Archive context
Older archive item. Useful for background and entity history, but not a fresh market-moving signal.

Key takeaways:
Bitcoin dropped over 4.5% on May 19, confirming a bearish divergence and threatening a break below $100,000.
Analysts highlight $97,000–$98,500 as key support that the bulls must hold.
A potential inverse head-and-shoulders pattern points to a retest of $91,000 before any bullish continuation.
Bitcoin (BTC) is down over 4.5% from its intraday high on May 19, falling to around $102,000 in its worst daily drop in over a month.
BTC/USD daily price chart. Source: TradingViewBTC’s drop accompanied downside moves elsewhere in the risk market, prompted by Moody’s latest downgrade of the US government due to a rising budget deficit and the lack of a credible fiscal consolidation plan.
The decline confirms a bearish divergence and, combined with other technical factors, raises the risk of a BTC price breakdown below $100,000, a key support level.
Bitcoin’s bearish divergence hints at sub-$100KBitcoin’s price action showed technical weakness ahead of its May 19 sell-off.
On May 19, BTC pushed to a new local high above $107,000, but its relative strength index (RSI) printed a lower high, confirming a classic bearish divergence.
Source: BluntzThis discrepancy between price and momentum is often a precursor to a trend reversal, and in this case, it played out with a swift 4.5% intraday decline. Analyst Bluntz warned traders to “be careful with [placing] longs.”
Swissblock analysts observed that Bitcoin “grabbed liquidity” above the $104,000–$106,000 resistance range but failed to sustain a breakout.
Bitcoin’s price vs. BTC onchain and trading volume. Source: SwissblockThe rejection pushed the price back into a prior volume-heavy zone, with immediate support between $101,500 and $102,500 now under pressure.
Swissblock identifies the $97,000–$98,500 range as a key downside target based on historical onchain volume and trading activity if the $101,500-102,500 area fails to hold.
Bitcoin’s H&S pattern targets $91,000On the three-day chart, Bitcoin is forming the right shoulder of a potential inverse-head-and-shoulders pattern.
While typically bullish in the long term, this setup implies a short-term retest of the 50-period exponential moving average (50-period EMA; the red wave) near $91,000.
BTC/USD three-day price chart. Source: TradingViewThe chances of such a drop have increased since BTC failed to close above the critical $107,000 neckline level, the same zone that triggered bearish reversals in December 2024 and January 2025.
Related: Metaplanet scoops 1,004 Bitcoin in 2nd-biggest buy ever
A rebound from the $91,000 zone toward the neckline at around $107,000 could increase Bitcoin’s odds of rising toward $150,000.
This article does not contain investment advice or recommendations. Every investment and trading move involves risk, and readers should conduct their own research when making a decision.
Why this matters
This bitcoin story adds another data point to the current market tape and is useful when read alongside nearby source coverage.
Original source
Read on CointelegraphRelated market context

Elon Musk Grok AI Predicts a Bold Move for Ethereum in 2026
When prompted, the Elon Musk-backed Grok AI predicts a bold move for Ethereum (ETH) over the remainder of 2026. It claims that if...
Bitcoin Price Still 33% Below Its Peak High as Bulls Plot a Comeback
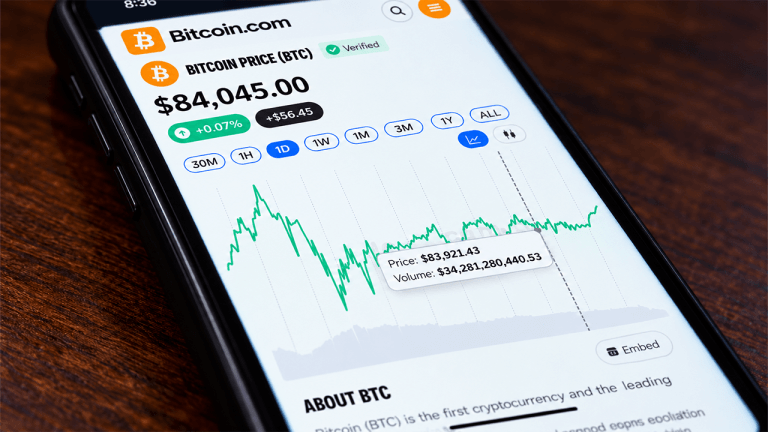
At 8:30 a.m. Eastern time, bitcoin’s price stood at $84,162 on Saturday, Sept. 26, 2026, down 0.51% over 24 hours, as the leading...

Bitcoin Price Never Closed Below Expectation in 2026 Bear Market
Bitcoin never posted a daily close below its realized price during the current bear market, and the June 2026 low held above that...

Bitcoin (BTC) Price Today: BTC Holds Uptrend as $84K FVG Shapes Intraday Setup
The setup comes as on-chain data shows that profit-taking remains relatively contained despite the latest Bitcoin price recovery....

Best Crypto Staking Platforms for 2026: 7 Options Compared
Staking is the closest thing crypto has to earning interest: you lock up a proof-of-stake asset to help secure its network, and in...
Old Magic Eden NFT approvals put users at risk after whitehat moves 3,832 NFTs
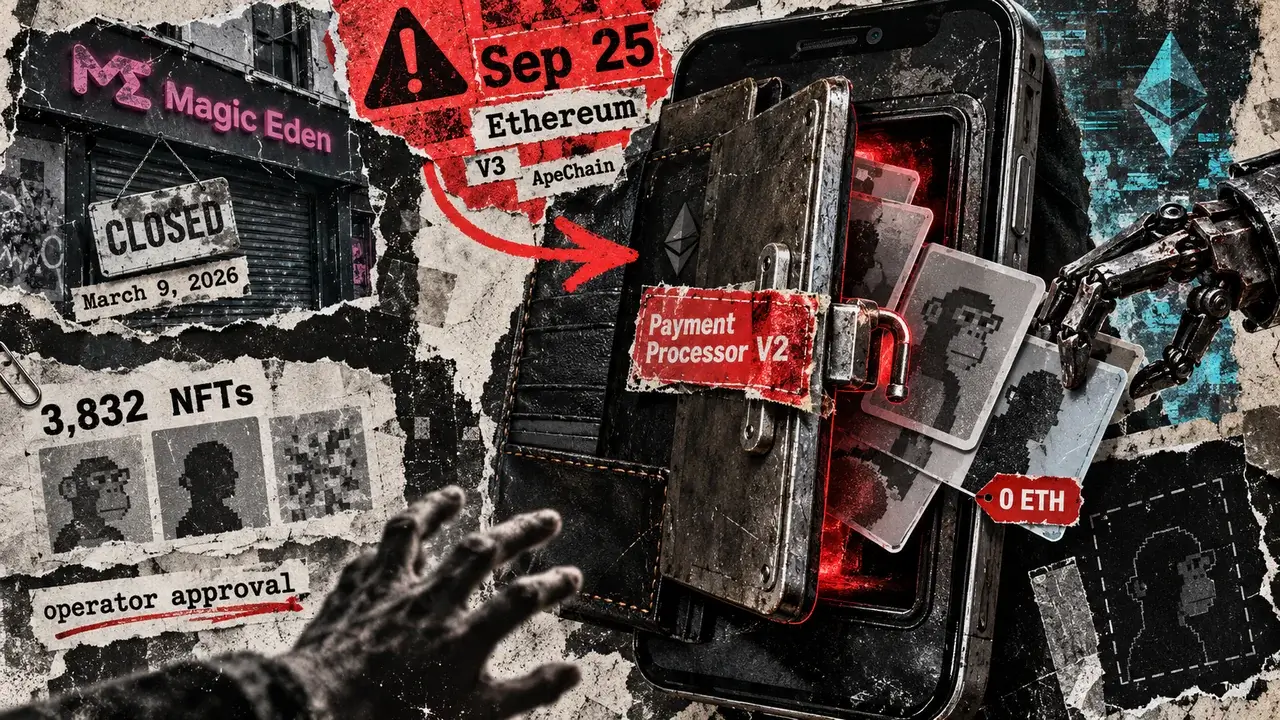
Old Magic Eden NFT approvals could still put some former users at risk months after the company closed its Ethereum marketplace. A...