Bitcoin Bulls Take Back Seat But Here’s Why Dips Are Still Attractive
Bitcoin price started a downside correction from the $35,000 resistance. BTC could start a fresh increase unless there is a move below $32,800. Bitcoin rallied toward the $35,000 resistance before the bears appeared. The...
Archive context
Older archive item. Useful for background and entity history, but not a fresh market-moving signal.

Bitcoin price started a downside correction from the $35,000 resistance. BTC could start a fresh increase unless there is a move below $32,800.
- Bitcoin rallied toward the $35,000 resistance before the bears appeared.
- The price is trading above $33,200 and the 100 hourly Simple moving average.
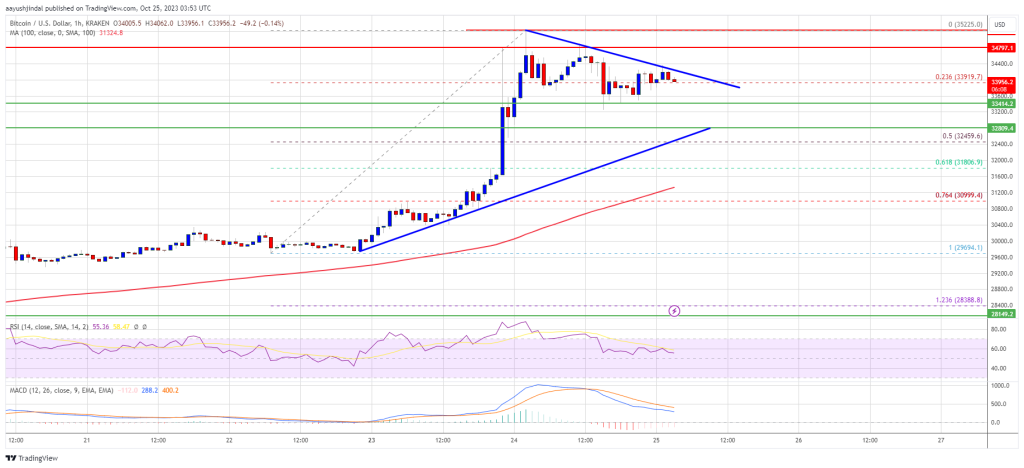
- There is a key breakout pattern forming with resistance near $34,050 on the hourly chart of the BTC/USD pair (data feed from Kraken).
- The pair could correct lower toward the $33,000 zone before it starts a fresh increase.
Bitcoin price rallied over 15% after there was speculation of spot ETF being listed DTCC. BTC surged toward the $35,000 resistance zone before the bears appeared.
A new multi-week high was formed near $35,225. Recently, the price started a downside correction below the $34,500 level. There was a move below the 23.6% Fib retracement level of the upward move from the $29,694 swing low to the $35,225 high.
Bitcoin is now trading above $33,200 and the 100 hourly Simple moving average. There is also a key breakout pattern forming with resistance near $34,050 on the hourly chart of the BTC/USD pair. The triangle support is close to the 50% Fib retracement level of the upward move from the $29,694 swing low to the $35,225 high.
On the upside, immediate resistance is near the $34,050 level. The next key resistance could be near $34,800. The main resistance is now forming near the $35,000 zone.
Source: BTCUSD on TradingView.com
A clear move above the $35,000 barrier might send the price toward the $36,200 resistance. The next key resistance could be $37,000. Any more gains might send BTC toward the $38,000 level in the coming days.
More Losses In BTC?If Bitcoin fails to rise above the $34,050 resistance zone, it could continue to move down. Immediate support on the downside is near the $33,400 level.
The next major support is near the $32,800 level and the triangle trend line. If there is a move below the trend line support, the price may perhaps decline toward the $31,500 level in the coming sessions.
Technical indicators:
Hourly MACD – The MACD is now losing pace in the bullish zone.
Hourly RSI (Relative Strength Index) – The RSI for BTC/USD is now above the 50 level.
Major Support Levels – $33,400, followed by $32,800.
Major Resistance Levels – $34,050, $34,800, and $35,000.
Why this matters
This bitcoin story adds another data point to the current market tape and is useful when read alongside nearby source coverage.
Original source
Read on NewsBTCRelated market context

Bitcoin (BTC) Price Prediction: $65K Remains Key Resistance as 4-Year Cycle Model Signals Make-or-Break Moment
The Bitcoin price today remains around $62,600-$62,900, according to TradingView data, reflecting a market that has stabilized fol...

Litecoin (LTC) Price Prediction: Mixed Technical Signals and Growing Hashrate Keep Traders Focused on $39 Support and $46 Breakout
Analysts are closely watching whether the Litecoin price can maintain support around $39 and break above the key $46 resistance le...

XRP Price Prediction: Judge in XRP Ruling Delivers Fresh Blow
Federal Judge Analisa Torres, the architect of XRP’s landmark 2023 securities ruling, has handed down another closely watched deci...

Cardano’s wallet hack exposed the user layer holding its on-chain government together
EMURGO said it is stepping down from its role in Pentad, the five-member group coordinating Cardano's infrastructure funding, to f...

Micron stock surges nearly 200% in 2026 as AI memory demand meets tokenized trading on Ethereum and Solana
Micron's stock surge highlights the transformative impact of AI and blockchain on traditional finance, with potential risks from m...

Bitcoin Price Prediction: Overlooked BTC Gold Ratio Is Flashing an Unexpected Signal
Bitcoin is hovering around $62,000, but the mood feels far less comfortable than the chart suggests. Bitcoin price prediction deba...