Bitcoin Cash Price Pumps Over 10% But $255 Is The Key To More Gains
Bitcoin Cash price rallied over 10% and broke the $245 resistance. BCH is now facing strong resistance near the $255 zone. Bitcoin cash price started a fresh surge above the $232 resistance. The price is trading above $2...
Archive context
Older archive item. Useful for background and entity history, but not a fresh market-moving signal.

Bitcoin Cash price rallied over 10% and broke the $245 resistance. BCH is now facing strong resistance near the $255 zone.
- Bitcoin cash price started a fresh surge above the $232 resistance.
- The price is trading above $245 and the 100 simple moving average (4 hours).
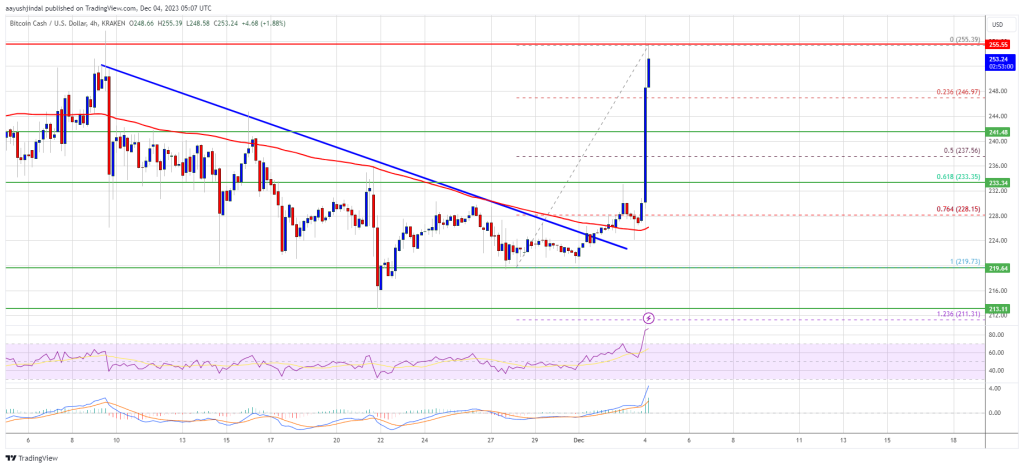
- There was a break above a key bearish trend line with resistance near $225 on the 4-hour chart of the BCH/USD pair (data feed from Kraken).
- The pair could continue to move up if it clears the $255 resistance zone.
After forming a base above the $220 level, Bitcoin Cash price started a steady increase. It broke the $225 resistance to enter a positive zone, like Bitcoin and Ethereum.
There was a break above a key bearish trend line with resistance near $225 on the 4-hour chart of the BCH/USD pair. There was a strong increase above the $232 and $245 resistance levels. The price is up over 10% and it is now testing the $255 resistance.
BCH is now showing positive signs above $245 and the 100 simple moving average (4 hours). It is also above the 23.6% Fib retracement level of the upward move from the $219 swing low to the $255 high.
Source: BCH/USD on TradingView.com
The price is now struggling to clear the $255 resistance. To continue higher, the price must settle above $255. The next major resistance is near $265, above which the price might accelerate higher toward the $280 level. Any further gains could lead the price toward the $300 resistance zone.
Fresh Drop in BCH?If Bitcoin Cash price fails to clear the $255 resistance, it could start a fresh decline. Initial support on the downside is near the $245 level.
The next major support is near the $232 level or the 61.8% Fib retracement level of the upward move from the $219 swing low to the $255 high, where the bulls are likely to appear. If the price fails to stay above the $232 support, the price could test the $225 support. Any further losses could lead the price toward the $220 zone in the near term.
Technical indicators
4-hour MACD – The MACD for BCH/USD is gaining pace in the bullish zone.
4-hour RSI (Relative Strength Index) – The RSI is currently in the overbought zone.
Key Support Levels – $245 and $232.
Key Resistance Levels – $255 and $265.
Why this matters
This bitcoin story adds another data point to the current market tape and is useful when read alongside nearby source coverage.
Original source
Read on NewsBTCRelated market context

Bitcoin (BTC) Price Prediction: $65K Remains Key Resistance as 4-Year Cycle Model Signals Make-or-Break Moment
The Bitcoin price today remains around $62,600-$62,900, according to TradingView data, reflecting a market that has stabilized fol...

Litecoin (LTC) Price Prediction: Mixed Technical Signals and Growing Hashrate Keep Traders Focused on $39 Support and $46 Breakout
Analysts are closely watching whether the Litecoin price can maintain support around $39 and break above the key $46 resistance le...

Ethereum Price Prediction: Hoskinson Accuses ETH of Taking Cardano Ideas Without Credit
Ethereum price has slipped as fresh ecosystem drama landed, which may bring its prediction down. All the while, buyers tried to de...

Crypto News, July 9: Iran Market Fears Fade as Bitcoin and Ethereum Price Shrug Off Another Panic
Fresh Iran headlines sent us scrambling last night, but the panic did not last. Markets, especially Bitcoin and Ethereum price, so...

Micron stock surges nearly 200% in 2026 as AI memory demand meets tokenized trading on Ethereum and Solana
Micron's stock surge highlights the transformative impact of AI and blockchain on traditional finance, with potential risks from m...

Bitcoin Price Prediction: Overlooked BTC Gold Ratio Is Flashing an Unexpected Signal
Bitcoin is hovering around $62,000, but the mood feels far less comfortable than the chart suggests. Bitcoin price prediction deba...