Bitcoin Cash Price Won’t Go Down Quietly – Risk of Bounce Grows
Bitcoin Cash price is holding the key $220 support against the US Dollar. BCH seems to be aiming for a fresh increase unless there is a move below $220. Bitcoin cash price is showing positive signs above the $220 level a...
Archive context
Older archive item. Useful for background and entity history, but not a fresh market-moving signal.
Bitcoin Cash price is holding the key $220 support against the US Dollar. BCH seems to be aiming for a fresh increase unless there is a move below $220.
- Bitcoin cash price is showing positive signs above the $220 level against the US Dollar.
- The price is trading above $220 and the 100 simple moving average (4 hours).
- There was a break below a key bullish trend line with support near $238 on the 4-hour chart of the BCH/USD pair (data feed from Kraken).
- The pair could start a fresh increase unless there is a move below $220.
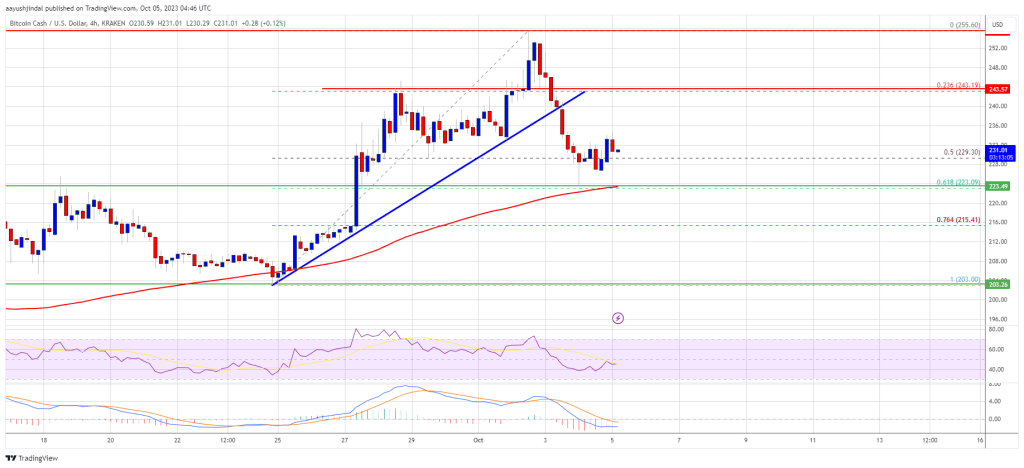
In the past few days, Bitcoin Cash price saw a steady decline from the $255 resistance zone. BCH declined below the $240 support to enter a short-term bearish zone, like Bitcoin and Ethereum.
The price declined below the 50% Fib retracement level of the upward move from the $203 swing low to the $255 high. Besides, there was a break below a key bullish trend line with support near $238 on the 4-hour chart of the BCH/USD pair.
However, the bulls were active above the $220 support. The price found support near the 61.8% Fib retracement level of the upward move from the $203 swing low to the $255 high.
Bitcoin Cash is now trading above $220 and the 100 simple moving average (4 hours). Immediate resistance is near the $236 level. The next major resistance is near $244. Any further gains could lead the price toward the $250 resistance zone.
Source: BCH/USD on TradingView.com
The next major hurdle is near the $262 level, above which BCH might start a decent increase toward the $280 level or $288 in the coming days.
Downside Break in BCH?If Bitcoin Cash price fails to clear the $244 resistance, it could start a fresh decline. Initial support on the downside is near the $225 level.
The next major support is near the $220 level, where the bulls are likely to appear. If the price fails to stay above the $220 support, the price could test the $212 support. Any further losses could lead the price toward the $200 zone in the near term.
Technical indicators
4-hour MACD – The MACD for BCH/USD is losing pace in the bullish zone.
4-hour RSI (Relative Strength Index) – The RSI is currently below the 50 level.
Key Support Levels – $225 and $220.
Key Resistance Levels – $236 and $244.
Why this matters
This bitcoin story adds another data point to the current market tape and is useful when read alongside nearby source coverage.
Original source
Read on NewsBTCRelated market context

Ethereum Price Prediction: Tom Lee Predicts $5 Trillion Ethereum
Ethereum price prediction is back in focus after Fundstrat co-founder Tom Lee floated a $5 trillion network valuation. ETH trades...
XRP Price Prediction: Judge in XRP Ruling Delivers Fresh Blow
Federal Judge Analisa Torres, the architect of XRP’s landmark 2023 securities ruling, has handed down another closely watched deci...

Bitcoin (BTC) Price Prediction: $65K Remains Key Resistance as 4-Year Cycle Model Signals Make-or-Break Moment
The Bitcoin price today remains around $62,600-$62,900, according to TradingView data, reflecting a market that has stabilized fol...

Litecoin (LTC) Price Prediction: Mixed Technical Signals and Growing Hashrate Keep Traders Focused on $39 Support and $46 Breakout
Analysts are closely watching whether the Litecoin price can maintain support around $39 and break above the key $46 resistance le...

JPMorgan’s $4.7T private blockchain warning just gave Bitcoin bulls fresh ammunition
JPMorgan sees Wall Street’s shift toward private blockchains as a deeper threat to Bitcoin than Strategy selling its BTC. JPMorgan...

Dogecoin Traders Watch $0.13 As DOGE Reclaims A Key Technical Level
Dogecoin Traders Watch $0.13 as DOGE Reclaims A Key Technical Level is the kind of crypto story that looks simple at headline leve...