Bitcoin Dives, Breaks $60K: Market Reels From Sharp Decline
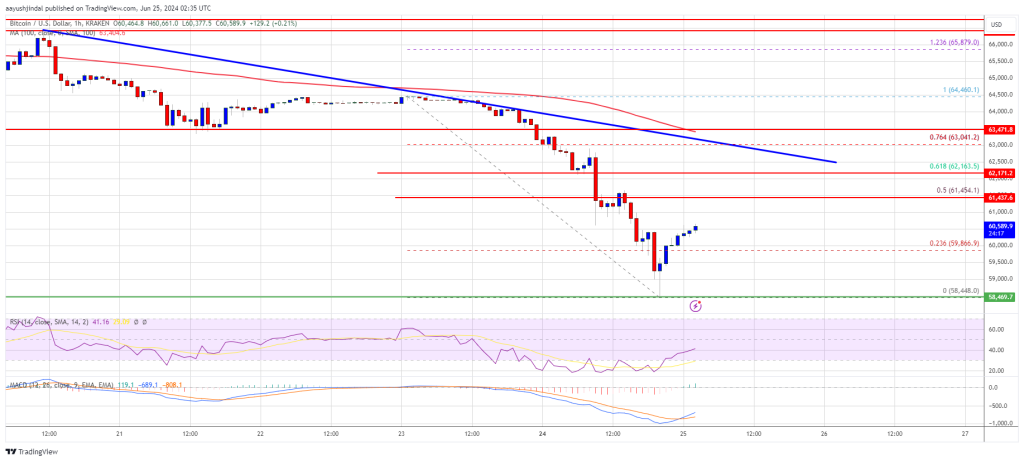
Bitcoin price gained bearish momentum and traded below $60,000. BTC is signaling a short-term downtrend and might face hurdles near $62,000. Bitcoin started a fresh decline from the $62,550 resistance level. The price is...
Archive context
Older archive item. Useful for background and entity history, but not a fresh market-moving signal.

Bitcoin price gained bearish momentum and traded below $60,000. BTC is signaling a short-term downtrend and might face hurdles near $62,000.
- Bitcoin started a fresh decline from the $62,550 resistance level.
- The price is trading below $61,500 and the 100 hourly Simple moving average.
- There is a key bearish trend line forming with resistance at $62,400 on the hourly chart of the BTC/USD pair (data feed from Kraken).
- The pair could correct higher, but upsides might be limited above the $62,000 resistance zone.
Bitcoin price failed to recover above the $63,500 level. BTC struggled above $63,000 and started another decline. There was a strong decline below the $62,000 and $61,500 levels.
The price even declined below the $60,000 level. A low was formed at $58,448 and the price is now correcting losses. There was a minor increase above the $59,800 level. The price climbed above the 23.6% Fib retracement level of the downward move from the $64,460 swing high to the $58,448 low.
Bitcoin price is now trading below $61,500 and the 100 hourly Simple moving average. If there is a recovery wave, the price could face resistance near the $61,500 level.
The first major resistance could be $62,150 or the 50% Fib retracement level of the downward move from the $64,460 swing high to the $58,448 low. The next key resistance could be $62,500. There is also a key bearish trend line forming with resistance at $62,400 on the hourly chart of the BTC/USD pair.
A clear move above the $62,500 resistance might start a steady increase and send the price higher. In the stated case, the price could rise and test the $63,500 resistance. Any more gains might send BTC toward the $65,000 resistance in the near term.
Another Drop In BTC?If Bitcoin fails to climb above the $62,500 resistance zone, it could continue to move down. Immediate support on the downside is near the $61,200 level.
The first major support is $60,000. The next support is now forming near $58,500. Any more losses might send the price toward the $57,000 support zone in the near term.
Technical indicators:
Hourly MACD – The MACD is now gaining pace in the bearish zone.
Hourly RSI (Relative Strength Index) – The RSI for BTC/USD is now below the 50 level.
Major Support Levels – $61,200, followed by $60,000.
Major Resistance Levels – $62,150, and $62,500.
Why this matters
This bitcoin story adds another data point to the current market tape and is useful when read alongside nearby source coverage.
Original source
Read on NewsBTCRelated market context

Bitcoin (BTC) Price Prediction: BTC Holds $63K Support—Can Rising Active Addresses Offset Bearish Technical Signals?
Although the BTC price has remained near a key support zone, recent chart signals and Strategy’s sale of a portion of its Bitcoin...

Bitcoin Price Prediction: Peter Brandt Might Dump BTC for Gold
Bitcoin is facing a test, and its price prediction is not helping. So far in 2026, BTC has fallen about 28%, while gold is down ju...

Bitcoin price rebounds to $63K as leverage returns creating short term volatility risk
Bitcoin's rebound has cleared the first test: price recovered. The harder one starts now: proving buyers remain after the squeeze....

Bitcoin miner bottom signal now depends on who survives weak mining profits
A Bitcoin miner-stress signal circulating on X has fallen into a zone analysts associate with severe miner pressure, putting a fam...

Bitmine’s Tom Lee ties ether strength to Clarity Act odds as treasury nears 5% of Ethereum’s total supply
Bitmine acquired 42,197 ether worth an estimated $74 million last week, lifting its treasury to over 5.7 million ETH.

Vitalik Buterin Says Ethereum’s Next Major Upgrade Will Take Three to Four Years and Rival the Merge
Ethereum co-founder Vitalik Buterin says the network’s next major overhaul, an initiative researchers are calling “Lean Ethereum,”...