Bitcoin Drops Again After Failed Recovery — $100K Support Now in Focus
Bitcoin price failed to recover above $105,000. BTC is trimming gains and might could continue to move down if it trades below $101,200. Bitcoin started a fresh decline after it failed to clear $105,500. The price is tra...
Archive context
Older archive item. Useful for background and entity history, but not a fresh market-moving signal.

Bitcoin price failed to recover above $105,000. BTC is trimming gains and might could continue to move down if it trades below $101,200.
- Bitcoin started a fresh decline after it failed to clear $105,500.
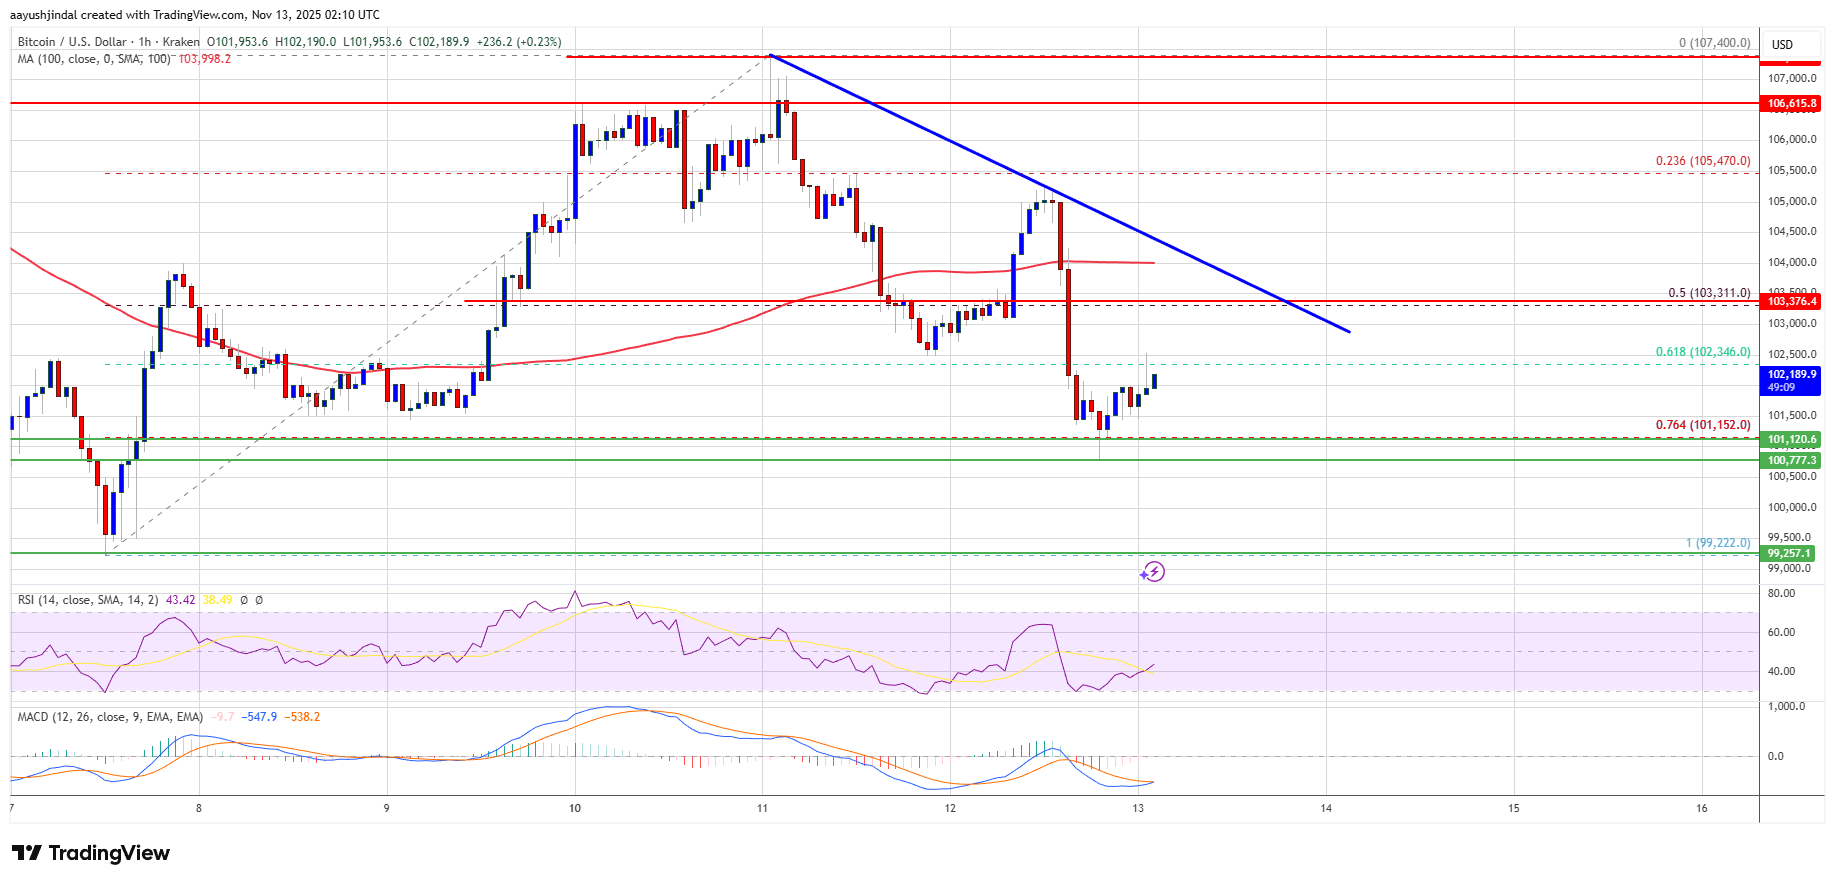
- The price is trading below $105,000 and the 100 hourly Simple moving average.
- There is a bearish trend line forming with resistance at $103,300 on the hourly chart of the BTC/USD pair (data feed from Kraken).
- The pair might continue to move down if it settles below the $101,200 zone.
Bitcoin price failed to stay in a positive zone above the $105,500 pivot level. BTC bears remained active below $105,500 and pushed the price lower.
The last swing high was formed at $107,400 before the price started a fresh decline. There was a drop below the $105,000 and $104,000 levels. The price dipped below the 61.8% Fib retracement level of the upward move from the $99,220 swing low to the $107,400 high.
Bitcoin is now trading below $104,000 and the 100 hourly Simple moving average. Besides, there is a bearish trend line forming with resistance at $103,300 on the hourly chart of the BTC/USD pair.
If the bulls attempt another recovery wave, the price could face resistance near the $102,500 level. The first key resistance is near the $103,250 level and the trend line. The next resistance could be $103,500. A close above the $103,500 resistance might send the price further higher. In the stated case, the price could rise and test the $105,000 resistance. Any more gains might send the price toward the $105,500 level. The next barrier for the bulls could be $106,800 and $107,000.
More Losses In BTC?If Bitcoin fails to rise above the $103,500 resistance zone, it could start another decline. Immediate support is near the $101,200 level and the 76.4% Fib retracement level of the upward move from the $99,220 swing low to the $107,400 high. The first major support is near the $100,500 level.
The next support is now near the $100,000 zone. Any more losses might send the price toward the $98,800 support in the near term. The main support sits at $96,500, below which BTC might accelerate lower in the near term.
Technical indicators:
Hourly MACD – The MACD is now gaining pace in the bearish zone.
Hourly RSI (Relative Strength Index) – The RSI for BTC/USD is now below the 50 level.
Major Support Levels – $101,200, followed by $100,500.
Major Resistance Levels – $103,250 and $103,500.
Why this matters
This bitcoin story adds another data point to the current market tape and is useful when read alongside nearby source coverage.
Original source
Read on NewsBTCRelated market context

Solana Price Prediction: SOL Holds Near $81 as Breakout Setup Points to $87, but Whale Flows Keep Risk Active
Solana price is back in focus after a sharp recovery pushed SOL towards the $81 area. The move has improved short-term momentum, e...

Bitcoin (BTC) Price Prediction: BTC Holds $63K Support—Can Rising Active Addresses Offset Bearish Technical Signals?
Although the BTC price has remained near a key support zone, recent chart signals and Strategy’s sale of a portion of its Bitcoin...

Ethereum (ETH) Price Prediction: ETH Holds Near $1,780 as Bulls Eye $1,860–$1,950, but $1,609 Remains Key Invalidation
Ethereum price is trading near $1,779 after a mixed 24-hour session, according to Brave New Coin data. ETH is down around 0.76% on...

Bitcoin Price Prediction: Peter Brandt Might Dump BTC for Gold
Bitcoin is facing a test, and its price prediction is not helping. So far in 2026, BTC has fallen about 28%, while gold is down ju...

Hyperliquid (HYPE) Price Prediction: Symmetrical Triangle Breakout Puts $77 Target Back in Focus
The breakout comes after several sessions of price compression, with HYPE continuing to trade within a broader technical structure...

Dormant $1.9M Bitcoin tied to New York lawsuit moves after nearly 15 years
A Bitcoin address dormant for nearly 15 years moved $1.9 million in BTC as a New York lawsuit seeks ownership of thousands of inac...