Bitcoin Eyes $63,000: Key Indicators Signal Further Decline – Time To Sell?
Bitcoin (BTC) is currently experiencing increasing bearish pressure, with technical indicators suggesting a potential decline toward the $63,316 mark. This price drop is driven by factors such as weakening momentum and d...
Archive context
Older archive item. Useful for background and entity history, but not a fresh market-moving signal.

Bitcoin (BTC) is currently experiencing increasing bearish pressure, with technical indicators suggesting a potential decline toward the $63,316 mark. This price drop is driven by factors such as weakening momentum and decreasing trading volume.
As Bitcoin targets the $63,316 mark, Investors and analysts are closely monitoring this development, as it may indicate further declines and set the stage for BTC to test lower support levels. This article analyzes Bitcoin’s current price movements and technical indicators signaling a potential further decline for the cryptocurrency focusing on the 4-hour and the 1-day chart.
Bitcoin currently has a market capitalization exceeding $1.3 trillion and a trading volume surpassing $39 billion. As of the time of writing, its price was down by 3.81%, trading around $66,814 over the last 24 hours. During this period, the asset’s market cap has decreased by 3.84%, while its trading volume has surged by 70.25%.
Technical Analysis: Key Bearish IndicatorsOn the 4-hour chart, the price of BTC looks bearish as it is currently dropping towards the 100-day Simple Moving Average (SMA). It can also be observed here that Bitcoin’s price has printed multiple bearish candlesticks as it approaches the $63,316 support level.
The Composite Trend Oscillator on the 4-hour chart further indicates a bearish trend, as both signal lines have fallen below the indicator’s SMA and are heading toward the zero level. If the price continues to decline as the indicator suggests, it could drop below the 100-day SMA, potentially reaching the $63,316 mark.
A closer examination of BTC’s movement on the 1-day chart shows that the failure to break above the 1-day trendline has led to a significant price drop toward the 100-day SMA and the $63,316 support level. This has resulted in Bitcoin successfully printing a bearish candlestick in the previous day’s trading.
Additionally, the 1-Day composite trend oscillator indicates a potential bearish decline, as the signal line is currently attempting to cross below the indicator’s SMA. If this crossover is successful, it could lead to further losses for the crypto asset.
Recovery Or Further Decline For Bitcoin?Should the digital asset’s price fall below the 100-day SMA and the $63,316 mark, it may continue to drop to test the $60,152 support level. When this level is breached, BTC may experience more price drops toward the $53,541 support range and possibly other levels below.
However, given that Bitcoin fails to decline further as predicted and turns to move upward, it will begin to move toward the $71,909 resistance level. It could move even higher to challenge the $73,811 resistance point if it breaks above $71,909 and possibly moves on to create a new all-high.
Why this matters
This bitcoin story adds another data point to the current market tape and is useful when read alongside nearby source coverage.
Original source
Read on NewsBTCRelated market context

Bitcoin (BTC) Price Prediction: BTC Holds $63K Support—Can Rising Active Addresses Offset Bearish Technical Signals?
Although the BTC price has remained near a key support zone, recent chart signals and Strategy’s sale of a portion of its Bitcoin...

Coinbase World Cup error shows prediction markets still have a proof problem
A reported Coinbase announcement about a World Cup result, likely using AI, created a problem bigger than a flawed alert. It showe...

Bitcoin miner bottom signal now depends on who survives weak mining profits
A Bitcoin miner-stress signal circulating on X has fallen into a zone analysts associate with severe miner pressure, putting a fam...
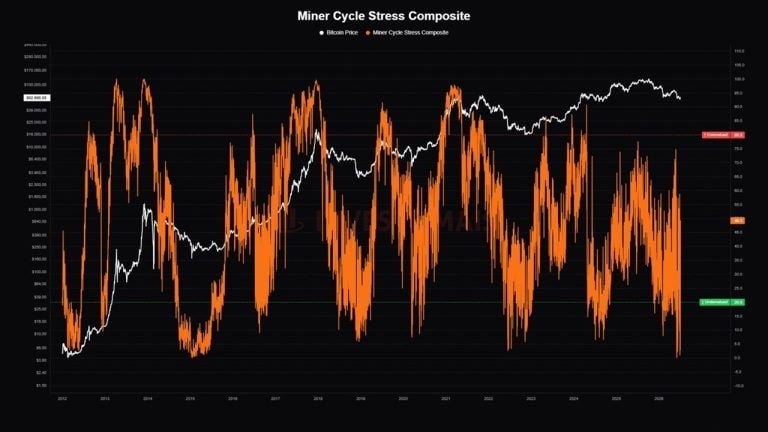
Bitcoin Miner Stress Hits ‘Historically Rare’ Level as 20% of Miners Operate at a Loss
Bitcoin’s Miner Cycle Stress Composite has fallen to a new 2026 low and entered its “undervalued” range, a synchronized decline pr...

Strategy Sells 3,588 Bitcoin to Fund Dividends as Saylor’s Treasury Model Meets Its First Real Test
Strategy (MSTR), the Michael Saylor–led company that turned corporate bitcoin accumulation into a Wall Street phenomenon, disclose...

Kraken Adds Bittensor Trading As AI Tokens Keep Pulling Exchange Attention
Kraken has added spot trading support for Bittensor’s TAO token, giving one of the most closely watched decentralized AI assets a...