Bitcoin Flashes Near-Identical Fractal Before The 2021 Bull Run Started
Bitcoin may be replaying a market structure that historically preceded one of its most powerful rallies. A high-timeframe trader has identified a fractal that closely mirrored Bitcoin’s behavior ahead of the 2021 bull ru...
Archive context
Older archive item. Useful for background and entity history, but not a fresh market-moving signal.

Bitcoin may be replaying a market structure that historically preceded one of its most powerful rallies. A high-timeframe trader has identified a fractal that closely mirrored Bitcoin’s behavior ahead of the 2021 bull run. He argues that the current cycle is unfolding in line with a well-established structural script observed across multiple market cycles spanning more than a decade.
Bitcoin’s Fractal: Rooted In High-Timeframe StructureThe fractal highlighted by the trader is based on a direct structural comparison between Bitcoin’s current cycle and the 2021 setup, illustrated in a chart he attached to his analysis. The chart aligns both periods to show how price advanced into a broad distribution range, rolled over into a sharp corrective phase, and then attempted to recover while capped by descending resistance. In both cases, Bitcoin retraced to the 0.382 Fibonacci level before stabilizing, marking a shared technical inflection point rather than a coincidental price overlap.
This structural symmetry extends beyond price levels into timing. According to the trader, the current cycle has tracked the rhythm of prior four-year cycles with notable consistency, allowing historical all-time highs and lows to be mapped objectively. Using that same framework, the data previously supported a high-probability short near the peak candle around $123,000, reinforcing his view that recurring market structure continues to guide directional risk.
By comparing the two cycles directly, the trader argues that Bitcoin’s behavior is being evaluated through a recurring structural pattern that has remained intact for more than 12 years, rather than through subjective bias.
$100,000 As A Structural And Psychological CeilingWithin the identified fractal, psychological resistance is a key determinant of Bitcoin’s upside potential. Looking back at 2021, Bitcoin failed to decisively reclaim the $50,000 level and instead front-ran it before reversing, establishing a behavioral precedent for how traders respond to significant round-number thresholds. Applying this pattern to the current cycle, $100,000 now functions as the analogous psychological ceiling. As a result, some participants may act preemptively, which could generate selling pressure from underwater holders and distribution by larger players.
This potential resistance is reinforced by diagonal trendlines that mirror the caps observed in 2021, creating a structural limit on upside momentum. Within this context, short-term extensions into the $98,000–$99,000 range remain plausible and are fully compatible with the fractal, as price can approach the psychological ceiling. Moreover, positioning data from the past six to eight months indicates that the median short-term buyer cost basis has clustered between $95,000 and $100,000, highlighting zones where profit-taking and defensive selling are likely to intensify.
These elements suggest a scenario where price may test resistance, experience temporary stalls, and respect structural limits without invalidating the broader high-timeframe thesis. However, the trader notes that the framework is probabilistic: only a sustained move above $104,000–$105,000 would break the fractal pattern and necessitate a full reassessment of the high-timeframe trend.
Why this matters
Bitcoin is a tracked market entity in the DigitalMoneyBox archive, making this useful context for readers monitoring repeated mentions and follow-up coverage.
Original source
Read on NewsBTCRelated market context

Sam Altman ChatGPT AI Predicts Bitcoin to Hit Insane All-Time High in 2026
Sam Altman’s ChatGPT AI predicts Bitcoin could reach a new all-time high in 2026, nearly doubling its October 2025 high of $126,00...

Meta AI Predicts This Huge Catalyst Could Lead to $40 XRP
Mark Zuckerberg’s Meta AI predicts an insanely wild bullish price target for XRP by January 1, 2027. The AI bot believes $25–$40 i...

XRP Price Prediction: Elliott Wave Setup Points to $3 as XRP Nears a Potential $2 Breakout
XRP Price Prediction: Elliott Wave Setup Points to $3 as XRP Nears a Potential $2 Breakout XRP is approaching a critical technical...

What Is Crypto Spot Trading?
For example, a token can be up 70% and still be a terrible trade if you have no idea when to take profits. Likewise, a 30% dip can...

BTC price support holds ahead of US CPI data: Three things Bitcoin traders need to know this week
Bitcoin traders braced for inflation-based volatility after BTC price action preserved key weekly support around $82,500.
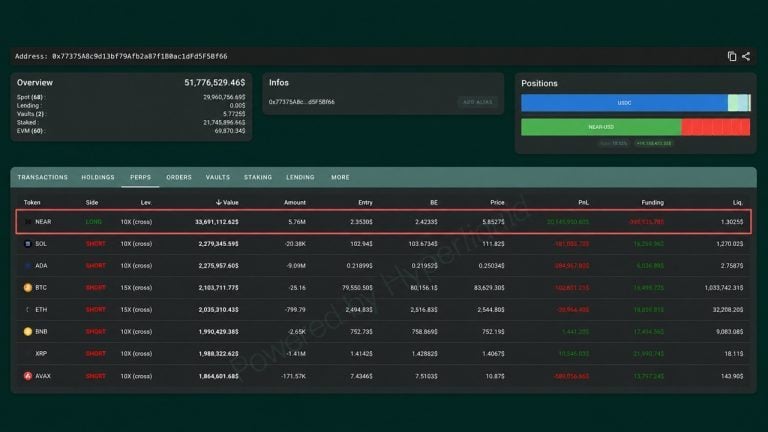
Shorting XRP, Bitcoin, Ether, SOL Has This NEAR Trader up $20 Million
A Hyperliquid trader who went long 5.76 million NEAR at $2.35 in September is now sitting on roughly $20.55 million in unrealized...