Bitcoin Futures Fakeout: The Price Divergence That Predicts A Phony
This week, Bitcoin traders braced for a breakout as an important technical buy signal triggered and BTCUSD shot up over $30,000 temporarily. They came up short-handed, however, as the market took an immediate turn back d...
Archive context
Older archive item. Useful for background and entity history, but not a fresh market-moving signal.

This week, Bitcoin traders braced for a breakout as an important technical buy signal triggered and BTCUSD shot up over $30,000 temporarily.
They came up short-handed, however, as the market took an immediate turn back down. Interestingly, the fakeout could have possibly been predicted by a divergence between two BTCUSD price charts.
Why Price Patterns And Technical Signals Can FailPrice patterns are tough to trade in cryptocurrencies. Because so many eyes are on the same pattern meeting precise parameters, the market has a way of making people pay for acting on the obvious. For example, a rising wedge pattern is typically bearish, but could breakout to the upside.
The same is true for technical signals that a large portion of traders are paying attention to, such as notable crossovers and changes in momentum. This is exactly the case recently with a bullish crossover of the daily BTCUSD Moving Average Convergence Divergence (MACD).
The MACD is a momentum indicator that gives a buy signal when the MACD line crosses the signal line from below. This signal not only has appeared in Bitcoin, but it confirmed on BTCUSD spot exchanges, so what gives? It was a phony signal from the “future.”
Spot Possible Divergences With Bitcoin FuturesBy “future” we mean BTC CME Futures, also known as Chicago Mercantile Exchange’s Bitcoin derivatives product, which institutions use to speculate on the underlying price of BTCUSD. The BTC CME Futures chart doesn’t always reflect spot BTCUSD charts 1:1. Any divergences between the two platforms, has historically led to fakeouts and phony breakouts.
Part of the reason for this is due to the platform shutting down for a short period each day, and for the entire weekend starting at Friday afternoon. The result is a Bitcoin chart with more traditional market traits, such as gaps. The missing price data also changes the calculation of many technical indicators. For example, moving averages are in slightly different locations from chart to chart.
This is precisely how the recent “fakeout” higher was able to be predicted with a degree of accuracy. This discrepancy and divergence leading to false signals is nothing new and has been happening for years. When BTC CME finally participates in the same signal, the expected results often then arrive.
Is this a situation similar to Dow Theory, where the DJIA and DJTA must confirm one another for a trend to be valid? Or is there some more at play? Whatever the case may be, there’s enough historical evidence at this point to pay attention to any divergences between spot and CME Futures.
Why this matters
This bitcoin story adds another data point to the current market tape and is useful when read alongside nearby source coverage.
Original source
Read on NewsBTCRelated market context

Bitcoin (BTC) Price Prediction: Glassnode Signals Potential Price Floor Near $80K as Sellers Capitulate
Similar spikes in Bitcoin’s realized losses preceded local price bottoms in August and September, raising the possibility that the...

Bitcoin Futures Open Interest Slips To $7.68 Billion As Traders Keep Funding Positive
TL;DR: A Saturday derivatives snapshot showed Bitcoin open interest at $7.68 billion, down 0.69% in 24 hours. Funding remained pos...

Trade futures without the wallet-hopping: Unified Wallet is now available in the EEA
TL;DR Unified Wallet is now available to EEA clients on Kraken Pro It combines your spot, margin, and futures balances into one sh...
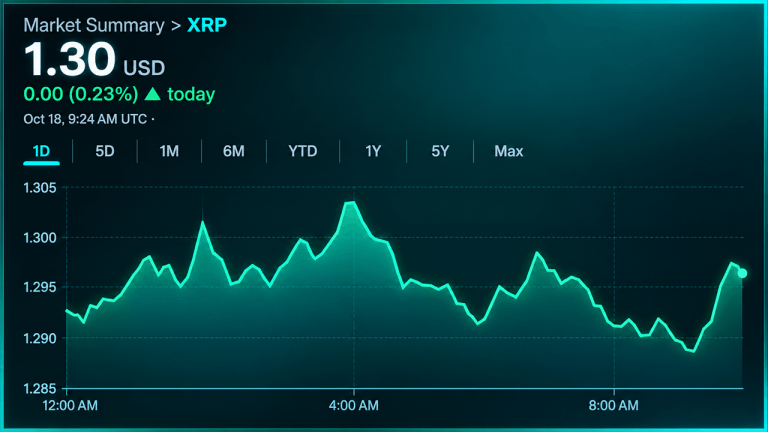
XRP Price Battles $1.30 as $2.77B Futures Market Loses Momentum
XRP’s price is fighting to hold $1.29 as its $2.77 billion futures market loses momentum and sellers maintain control. Technical i...

Google Gemini AI Predicts Bitcoin to Hit $175K by 2027
When prompted, Google Gemini AI predicts that by January 1, 2027, Bitcoin could be trading for $175,000. It gives a hypothetical c...

Bitcoin Price Forecast: $81,500 Leaves Weekly Close Needing a Big Push
Sunday’s (October 18) Bitcoin price forecast puts it near $ 81,600, with technical indicators sending mixed signals. Shorter-term...