Bitcoin Is Struggling To Hold Its 200-Day MA
Despite the traditional stock market view on 200-day moving averages, a dip below it could mean a sale event for Bitcoin.Bitcoin has been trading at sideways price action for most of December, struggling to stay above th...
Archive context
Older archive item. Useful for background and entity history, but not a fresh market-moving signal.
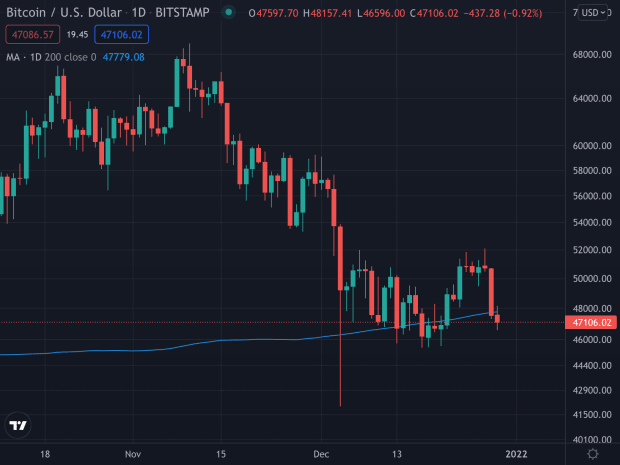
Despite the traditional stock market view on 200-day moving averages, a dip below it could mean a sale event for Bitcoin.
Bitcoin has been trading at sideways price action for most of December, struggling to stay above the 200-day moving average.
After a strong October and an early November of new all-time highs, Bitcoin has encountered a blocking road in December, having lost 13.60% since the beginning of the month. This reality stands in stark contrast to a widespread belief that Bitcoin’s price would hit $100,000 by the end of the year.
At the time of writing, Bitcoin is trading at around $47,500 after having closed below its 200-day moving average on Tuesday. The 200-day MA is often used to gauge an asset’s long-term trend in traditional capital markets. An asset is generally considered to be in an overall uptrend for as long as it holds above its 200-day MA.
Bitcoin closed below its 200-day moving average yesterday. Source: TradingView.In March 2020, Bitcoin violently broke below its 200-day MA as the pandemic outbreak spread fear throughout the world, including capital markets. It took BTC about two months to get back above the moving average, triggering a stellar bull market that would extend past the end of the year. Bitcoin held above its 200-day MA for over a year until China banned bitcoin mining, once again spreading fear to those unaware of Bitcoin’s actual functioning mechanics and triggering a short winter for price over the summer months.
Bitcoin rose from $8,000 to $60,000 in less than one year before correcting below its 200-day MA at around $40,000 in May 2021. Source: TradingView.Despite the traditional stock market view that an asset below its 200-day MA could be in a bear market, for Bitcoin, it could represent a sale event. Given the peer-to-peer (P2P) currency’s strong, unique fundamentals and its history of crushing all other assets over the past 10 years, a dip below a technical indicator can serve as a discount indication, especially given Bitcoin’s volatility, which makes it plunge and soar more rapidly than traditional assets.
Why this matters
This bitcoin story adds another data point to the current market tape and is useful when read alongside nearby source coverage.
Original source
Read on Bitcoin MagazineRelated market context

NYSE owner and OKX plan 24/7 tokenized stock trading using Uniswap
Intercontinental Exchange and OKX are preparing an always-open market where tokenized US stocks could keep repricing after Wall St...

Strive Buys 2,000 Bitcoin and Discloses a Buyback Facility for Its Preferred Stock
Strive bought 2,000 bitcoin last week, more than in any of its previous four weekly buys, and disclosed a facility to buy back up...

XRP Price Prediction: Analyst Calls $750 Ripple Next Year
XRP traded at $1.51, printing 1% gain as its price prediction was pinned near the middle of its recent range. Jake Claver is still...

Strategy buys just 334 Bitcoin as preferred-share buybacks reach $1.45 billion
Strategy (formerly MicroStrategy) made its smallest positive Bitcoin purchase of 2026 even as a 43% quarterly rally in the cryptoc...

Metaplanet sold 10,000 Bitcoin in a credit-rating bid, only to buy back 11,000 BTC at a higher price per coin
Metaplanet sold 10,000 Bitcoin and later bought back 11,000 BTC to strengthen its credit profile and expand beyond accumulation du...

Ethereum Price Prediction: ETH Liquidity Drops 45% Below BTC
Ethereum price prediction is dropping as its order-book depth has fallen to 35–45% of Bitcoin’s. Ethereum trades at $2,725, up 1%...