Bitcoin Leverage Cooldown Signals Market Reset: OI Drops 21% As Excess Risk Is Flushed Out
Bitcoin continues to consolidate below the $105,000 mark, maintaining stability above the key $100,000 support level despite ongoing market uncertainty. Bulls appear to be losing momentum, yet sellers are showing signs o...
Archive context
Older archive item. Useful for background and entity history, but not a fresh market-moving signal.

Bitcoin continues to consolidate below the $105,000 mark, maintaining stability above the key $100,000 support level despite ongoing market uncertainty. Bulls appear to be losing momentum, yet sellers are showing signs of exhaustion as the price resists further decline. According to top analyst Darkfost, the market has entered a clear deleveraging phase following the major liquidation event on October 10 — a structural reset that is removing excessive leverage from the system.
Data shows that open interest — the total value of active futures contracts — has fallen by 21% over the past 90 days, marking one of the steepest declines of the cycle. This drop reflects traders reducing risk exposure and liquidations steadily clearing overleveraged positions.
Darkfost notes that leverage usage is gradually cooling down, with the current drawdown echoing previous cleansing phases seen in September 2024 and April 2025. Historically, such periods of forced unwinding have preceded new market strength as liquidity stabilizes and speculative excess fades.
Deleveraging Signals a Potential Turning Point for BitcoinDarkfost explains that the current deleveraging phase bears striking similarities to previous corrective periods that ultimately paved the way for major recoveries. During the September 2024 and April 2025 corrections, open interest fell by approximately 24% and 29%, respectively — deep enough to flush out excessive speculation and restore balance across the market.
With the current 21% decline in open interest over the last three months, Bitcoin is now approaching those same historical levels of leverage reduction. According to Darkfost, these phases are not necessarily bearish; instead, they serve as healthy resets during bullish market cycles. By forcing overleveraged traders to exit and cooling down speculative behavior, the market is able to rebuild on a stronger, more stable foundation.
In past cycles, such unwinding events were often followed by trend reversals once selling pressure eased and new demand emerged. The reduction in leverage also tends to attract long-term investors and institutions seeking lower-risk entry points.
If Bitcoin continues to hold its ground above $100K through this period of structural cleanup, it could signal that the worst of the correction is over, setting the stage for a potential new impulse phase once confidence returns.
BTC Tests Support As Consolidation Continues Above $100KThe weekly Bitcoin chart shows that BTC remains in a tight consolidation range between $100,000 and $105,000, testing key structural support. The price has repeatedly defended the 100-day moving average (blue line), indicating that despite sustained selling pressure, buyers continue to step in around this psychological zone.
The overall trend remains bullish on higher timeframes, with the 200-week moving average (red line) trending upward and well below current price action — a signal that Bitcoin’s long-term market structure remains intact. However, momentum indicators reflect weakness, as BTC struggles to reclaim the $110,000 resistance level that capped previous rebound attempts.
Trading volume has decreased since the October liquidation event, aligning with Darkfost’s observation that the market is undergoing a deleveraging phase. This lower volume environment suggests investor hesitation but also indicates that forced selling may be nearing exhaustion.
A decisive weekly close above $106,000 could confirm renewed bullish momentum, while a breakdown below $100,000 might trigger deeper corrections toward $92,000 — the next major support zone.
Featured image from ChatGPT, chart from TradingView.com
Why this matters
This bitcoin story adds another data point to the current market tape and is useful when read alongside nearby source coverage.
Original source
Read on NewsBTCRelated market context

Bitcoin Recoils Below $86,000: Is Bitcoin Price Prediction Still Shooting For $90,000?
Bitcoin Price Prediction: Bitcoin (BTC) trades at $85,954, down a modest 0.3% on the day, holding the upper band of a rebound that...

Solana Price Prediction: Golden Cross and $2.97B Open Interest Put $400 Target in Focus
Solana price is trading near $117.38 after recovering strongly from its recent lows. With SOL now testing the crucial $118–$120 re...
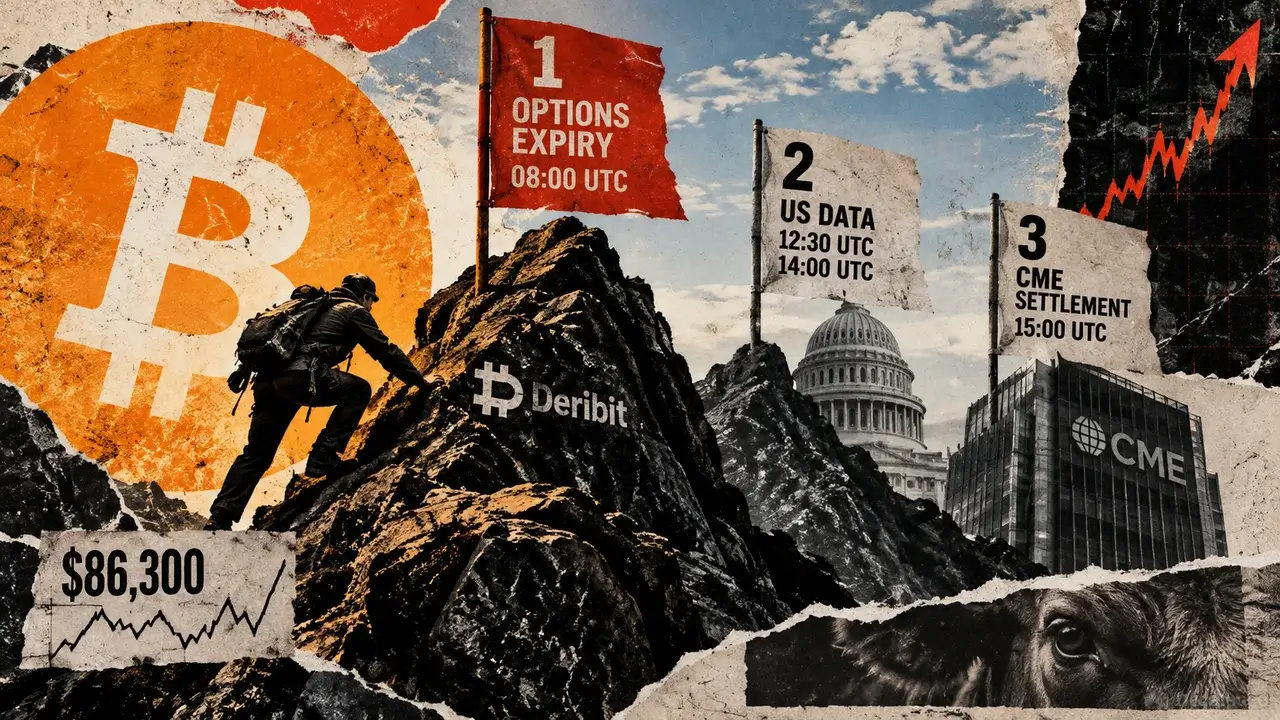
Bitcoin faces $16 billion options expiry Friday, then two more tests hit the rally
Bitcoin options carrying roughly $16 billion in notional value expire on Deribit at 08:00 UTC on Friday, Sept. 25. Calls account f...

Narrowing price cushions leave Bitcoin loans vulnerable to 4.7% price dips as Aave weighs higher leverage
Aave governance has advanced a proposal that would give Bitcoin-backed borrowers materially more leverage while leaving less room...

ETH USD Loses Ground as Ethereum Price Analysis Remains Targeting $3,000 This Week
Ethereum Price Prediction, September 23: Ethereum (ETH) trades at $2,735, down a marginal 0.61% over the past 24 hours, a pause, n...

XRP Price Today: XRP Hits $1.60 as Heavy Whale Accumulation Points to a $2 Rally and Beyond
The XRP price reached $1.6060 on September 23 after opening near $1.5808, according to historical market data. The token subsequen...