Bitcoin Macro Index Enters ‘Expansion’, Echoing 400% Bull Run Surge
In a detailed market update, Charles Edwards, founder of Capriole Investment, has provided an in-depth analysis of Bitcoin’s current market position, highlighting a pivotal shift to an ‘expansion’ phase in the Bitcoin Ma...
Archive context
Older archive item. Useful for background and entity history, but not a fresh market-moving signal.

In a detailed market update, Charles Edwards, founder of Capriole Investment, has provided an in-depth analysis of Bitcoin’s current market position, highlighting a pivotal shift to an ‘expansion’ phase in the Bitcoin Macro Index. This transition is particularly noteworthy as it parallels conditions observed prior to historical price surges in Bitcoin’s valuation.
Bitcoin has recently experienced a sharp uptick, ascending from $34,000 to an interim high of $38,000. After a brief period of resistance, the price corrected to approximately $36,500. Edwards highlights this movement as a critical technical victory, with Bitcoin overcoming and holding above the major resistance benchmarks of $35,000 on both the weekly and monthly timeframes.
This consolidation above key resistance levels sets a bullish context in the high timeframe technical analysis, positioning Bitcoin in a strong technical stance according to traditional market indicators. “The recent breakout into the 2021 range offers the best high timeframe technical setup we have seen in years. Provided $35K holds on a weekly and monthly basis in November, the next significant resistance is range high ($58-65K).”
Bitcoin Macro Index Enters ExpansionThe crux of Edwards’ update is the shift in the Bitcoin Macro Index, a complex model synthesizing over 40 metrics encompassing Bitcoin’s on-chain data, macro market indicators, and equity market influences. The index does not take price as an input, thus providing a ‘pure fundamentals’ perspective.
The current expansion is the first since November 2020, and only the third instance since the index’s inception, with the two previous occasions leading to substantial price rallies in the following periods. Edwards elucidates this with a direct quote: “The transition from recovery to expansion is simply the optimal time to allocate to Bitcoin from a risk-reward opportunity for this model.”
A look at the Bitcoin chart reveals that the Bitcoin price rose by a whopping 400% during the last bull run from early November 2020 to November 2021, after the Macro Index entered the expansion phase. The first historical signal was provided by the Macro Index on November 9, 2016, which was followed by a massive bull run of almost 2,600% until Bitcoin reached its then all-time high of $20,000 in February 2018.
Short-Term Technicals And Derivatives Market AnalysisIn the short term, the technical outlook presents a mixed picture, according to Edwards. The derivative markets are indicating an overheated state, with low timeframe analysis suggesting a retracement could be imminent. Edwards introduces the ‘Bitcoin Heater’ metric, recently launched on Capriole Charts, which aggregate various derivatives market data and quantify the level of market risk based on the open interest and heating level of perpetuals, futures, and options markets.
The below chart shows that most of the time when the Bitcoin Heater is above 0.8, the market corrects or consolidates. “But there are large exceptions to the rule: such as the primary bull market rally from November 2020 through to Q1 2021. […] We should expect this metric to be high more frequently in 2024 (much like Q4 2020 – 2021),” Edwards stated.
The analyst concluded that the overall trend for Bitcoin remains positive, with major data points indicating a strong bullish scenario. However, he also cautioned about potential short-term risks in the low timeframe technicals and derivatives market. These, according to him, are common in the development of a bull run and could offer valuable opportunities if dips occur.
At press time, BTC traded at $35,626.
Why this matters
This bitcoin story adds another data point to the current market tape and is useful when read alongside nearby source coverage.
Original source
Read on NewsBTCRelated market context

Bitcoin (BTC) Price Today: Whale Buying Strengthens Bullish Case as BTC Consolidates Near $79K
At the same time, technical indicators show that the recent rally has become stretched, leaving Bitcoin price caught between a con...

XRP Price Targets $2 as One Key Metric Flashes Bullish Signal
XRP price is sitting in a corrective pocket after one of its stronger months of the year. That $2 target sounds ambitious given th...

Bitcoin Faces a Three-Way Macro Test Near $78,000
Bitcoin traded at $78,500 as the Japanese yen breached 160 per dollar in Tokyo trading, while a U.S. strike on Iran’s Larak Island...

Dogecoin (DOGE) Price Prediction: DOGE Holds Near $0.084 as $0.09 Breakout Could Open $0.115
Dogecoin is back in the spotlight as price slips towards the $0.084 area, putting an important support zone under pressure. The la...

Ethereum News: Hayes Backs ETH as It Strengthens Against Bitcoin
Ethereum is flatlining, but the number doesn’t really matter now, as the ETH/BTC ratio and Arthur Hayes’ news have given us a reas...
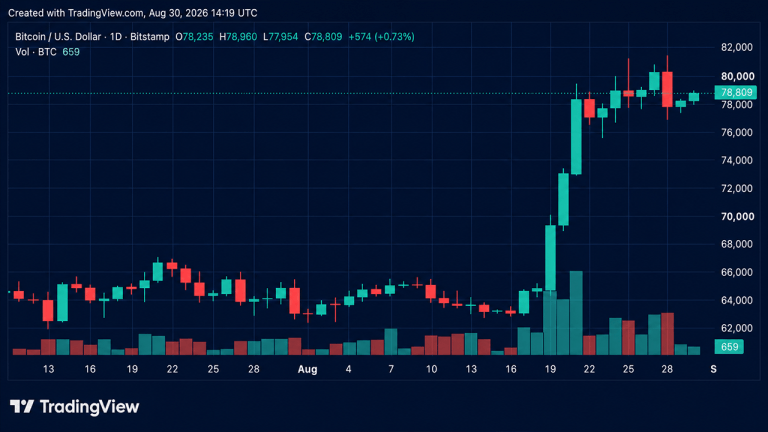
Bulls Reload for Another Assault on $81K as Bitcoin’s Price Rises
On Sunday, bitcoin’s price saw a rise of 1.5%, climbing to an intraday high of $78,960 before hitting some resistance. The leading...