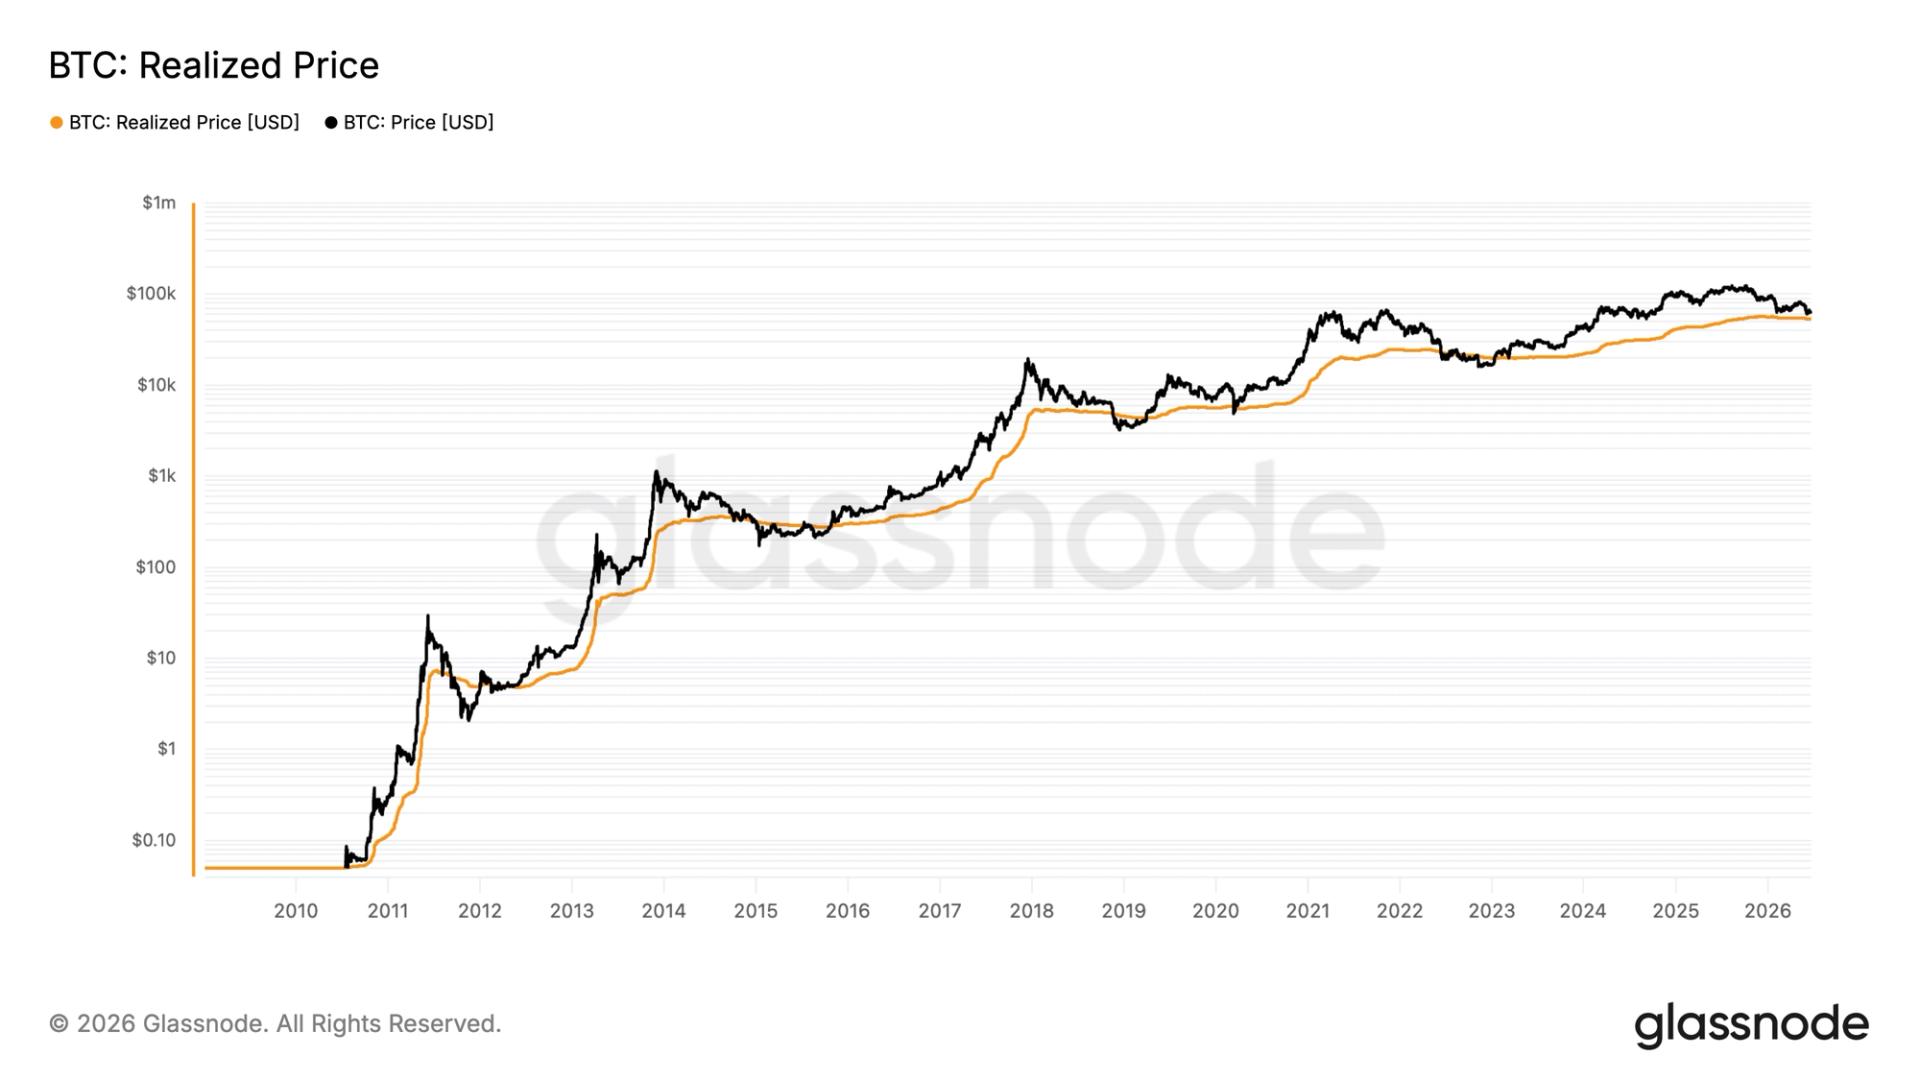
Bitcoin may need to plunge 15% or more to mark bottom, according to this long-time indicator
With bitcoin testing its 200 week moving average, on-chain data suggests the $50,000 to $54,000 range could become the next key battleground.
Archive context
Older archive item. Useful for background and entity history, but not a fresh market-moving signal.
Why this matters
Bitcoin is a tracked market entity in the DigitalMoneyBox archive, making this useful context for readers monitoring repeated mentions and follow-up coverage.
Original source
Read on CoinDeskRelated market context
Dune Adds Real-Time Spot And Perpetual Trade Feeds Across On-Chain Markets
TL;DR: Dune has launched normalized real-time feeds for spot and perpetual DEX trades, designed to help institutional desks compar...

Bitcoin Bettors Push Kalshi and Polymarket to a Record $2.7B Week
Crypto contracts on Kalshi and Polymarket hit a record $2.7 billion in weekly volume, driven mostly by short-term bets on where bi...

Kalshi and Polymarket hit record $2.7 billion in weekly crypto volume
The surge in crypto prediction market volume highlights a shift towards short-term speculative trading, impacting traditional trad...
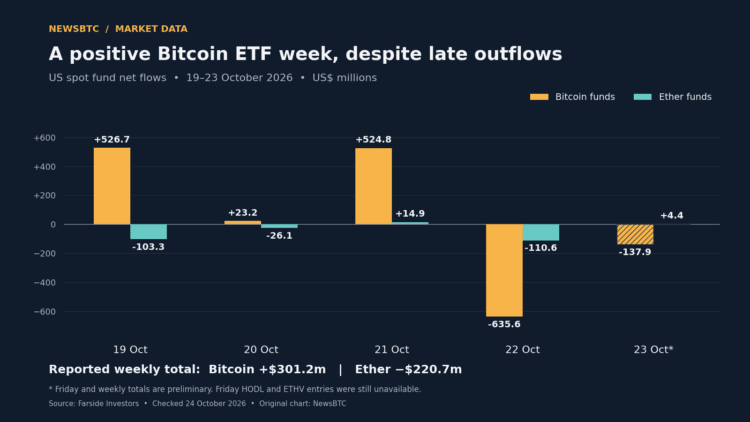
Bitcoin ETF Week Stays Positive After Nearly $774 Million In Late Outflows
TL;DR: Farside’s preliminary figures show US Bitcoin funds retaining a $301.2 million weekly inflow despite two days of withdrawal...

Phantom Starts a Staged US Launch of In-Wallet Prediction Markets
US users of Phantom can now trade prediction markets in the wallet, under a staged launch that began Friday and runs through Kalsh...
JPMorgan Expands Tokenized Money Market Funds To Solana
TL;DR: J.P. Morgan Asset Management says qualified U.S. investors can now access MONY and JLTXX tokenized money market funds on So...