Bitcoin Mirrors Historical Pullback Ranges – Healthy Correction Or Trouble Ahead?
Bitcoin is facing renewed volatility after losing the $110,000 level just a few days ago, a breakdown that has fueled uncertainty across the market. Bulls are attempting to reclaim this crucial support, but fear of a dee...
Archive context
Older archive item. Useful for background and entity history, but not a fresh market-moving signal.

Bitcoin is facing renewed volatility after losing the $110,000 level just a few days ago, a breakdown that has fueled uncertainty across the market. Bulls are attempting to reclaim this crucial support, but fear of a deeper correction continues to weigh heavily on sentiment. With every failed rebound, traders are left questioning whether this pullback is simply a pause within the broader uptrend or the beginning of a larger downtrend.
Crypto analyst Darkfost has shared new data providing context for the current environment. Since Bitcoin’s most recent all-time high near $123,000, the asset has retraced by roughly -12%. According to Darkfost, this move remains well within the boundaries of a normal correction, especially when compared to historical pullbacks in previous bull cycles.
Such corrections are often healthy, serving to reset leverage, cool overheated sentiment, and create fresh entry points for long-term investors. While uncertainty remains in the short term, history suggests that Bitcoin’s current retracement does not necessarily signal the end of the cycle. Instead, it may represent a period of stabilization before the next major move.
Bitcoin Correction Aligns With Historical PatternsAccording to Darkfost, Bitcoin’s current retracement should be viewed within the broader context of this cycle rather than as a sign of structural weakness. Looking more closely, since the first all-time high in March 2024, the largest drawdown recorded so far reached 28%. Importantly, Bitcoin has not corrected more deeply than that throughout the ongoing bull market.
Historically, the most severe pullbacks in bullish phases have averaged between -20% and -25%, placing the present move well within the expected range. With Bitcoin now down roughly 12% from its latest all-time high of $123,000, the retracement is still modest compared to prior cycle corrections. Darkfost emphasizes that this behavior is not unusual and could even extend further without breaking the underlying bull trend.
In fact, such drawdowns are often healthy and necessary in long-term uptrends. They serve several functions: flushing out excessive leverage in the derivatives market, cooling down overheated sentiment, and shaking out short-term speculators. At the same time, they create new entry opportunities for investors who may have missed earlier stages of the rally.
For long-term holders and institutions, these phases are less about panic and more about preparation. Historically, similar corrections have preceded renewed strength, as Bitcoin stabilizes before resuming its upward trajectory. If the current pattern holds, this retracement may ultimately strengthen the market foundation, setting the stage for the next leg of growth.
Testing Recovery Level After Deep PullbackBitcoin is attempting to recover after a sharp correction that took the price down to the $108K region. As shown in the chart, BTC recently bounced back above $110K but continues to struggle to sustain momentum. The rejection from the $123K zone marked the cycle’s most recent all-time high, and the market has since been in a retracement phase.
The 12-hour chart highlights how BTC dipped below its 200-day moving average (red line) but quickly rebounded, signaling that bulls are still defending this crucial support. The 50-day (blue) and 100-day (green) moving averages, however, are trending downward, suggesting that pressure remains in the short term. BTC will need to reclaim the $112K–$115K zone to shift sentiment back toward bullish momentum.
On the downside, losing the $108K level could open the door to a deeper correction toward $105K or even the $101K region, where the 200-day MA sits as the last line of defense.
Bitcoin is consolidating in a fragile position. A decisive move above $115K could reignite bullish momentum, but failure to hold current support may confirm a prolonged correction phase before any attempt at a new all-time high.
Featured image from Dall-E, chart from TradingView
Why this matters
This bitcoin story adds another data point to the current market tape and is useful when read alongside nearby source coverage.
Original source
Read on NewsBTCRelated market context

Bitcoin Gives Back More Than $3,500 as 10-Year Treasury Yield Reaches a 19-Year High
Bitcoin traded below $84,000 early Thursday, down about 3% over 24 hours and more than $3,500 below Wednesday’s early high above $...
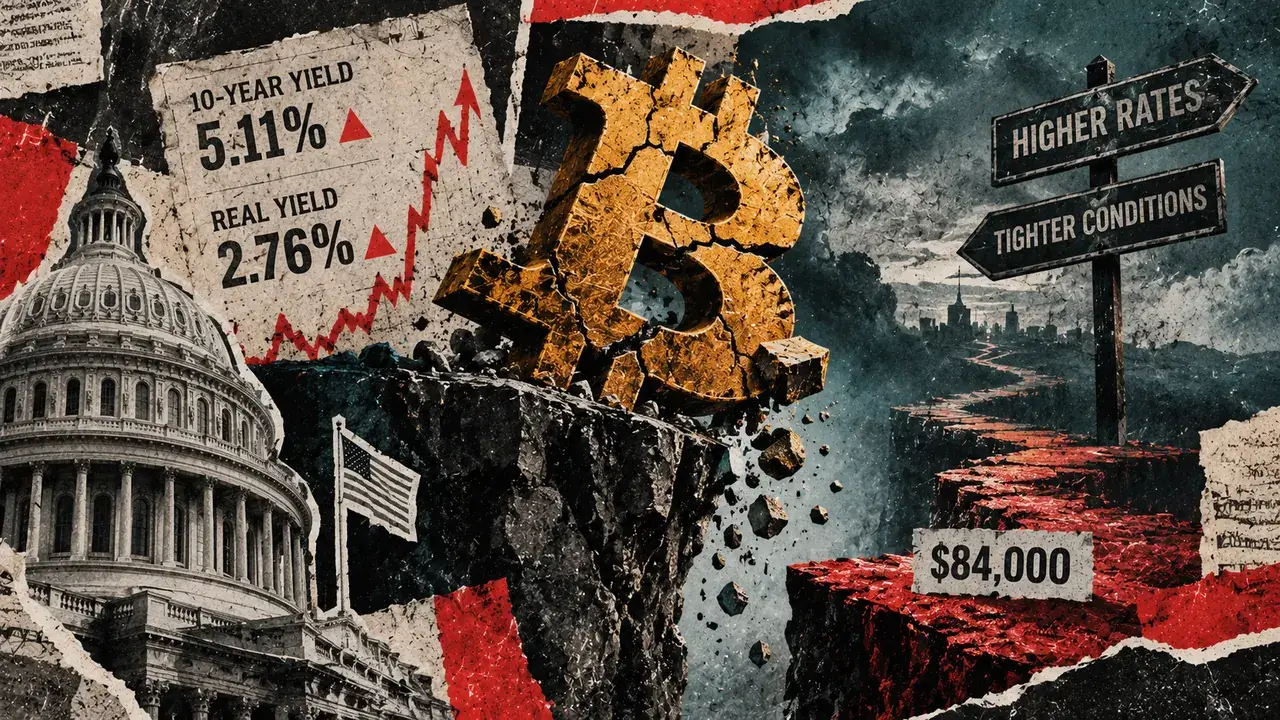
Why surging US real yields are quietly forcing Bitcoin under $84,000
Bitcoin registered an intraday low at $83,500 on Sept. 23, the same day the US 10-year Treasury yield closed at 5.11%, up 15 basis...

XRP Price Prediction: October is a Weak Month for Ripple, But 3 Metrics Point Bullish
XRP is trading at $1.50, down 7.6% over the past 24 hours after reaching $1.63 during the period. Despite the pullback and a beari...

Vitalik Buterin highlights need for new cryptographic tools in blockchain
Buterin's call for new cryptographic tools signals a pivotal shift towards enhanced privacy and efficiency in blockchain technolog...

Bitget moves institutional collateral to Sygnum’s off-exchange custody
The shift to off-exchange custody enhances institutional trust in crypto, mitigating insolvency risks and promoting broader market...

Bitcoin drops from eight-month high as yields and dollar rise
Bitcoin's sensitivity to macroeconomic shifts highlights the ongoing challenge for crypto markets to decouple from traditional fin...