Bitcoin Momentum Indicators Are All Showing Death Cross: Say Hello To Bear Market?
Data shows three popular Bitcoin momentum indicators recently formed a death cross pattern. Here’s what usually follows this formation. Bitcoin Momentum Indicators Have Seen Bearish Crossovers Recently In a new CryptoQua...
Archive context
Older archive item. Useful for background and entity history, but not a fresh market-moving signal.

Data shows three popular Bitcoin momentum indicators recently formed a death cross pattern. Here’s what usually follows this formation.
Bitcoin Momentum Indicators Have Seen Bearish Crossovers RecentlyIn a new CryptoQuant Quicktake post, an analyst has discussed the latest trend in three momentum indicators related to Bitcoin. The momentum indicators here refer to combinations of some important moving averages (MAs) related to the cryptocurrency.
The first is the “Active Address Momentum,” which involves the 30-day and 365-day MAs of the daily unique number of BTC Active Addresses. An address is said to be “active” when it makes some transaction on the network, whether as a receiver or sender.
The number of Active Addresses may be the same as the number of users visiting the network, so this metric tells us how the blockchain activity is looking right now.
Here is the chart shared by the quant that shows the trend in the 30-day and 365-day MAs of the Active Addresses over the last few years.
As displayed in the above graph, the monthly average of the Active Addresses saw a cross under the yearly average shortly after the asset’s rally to the new all-time high (ATH) and has since remained under it.
This crossover implies activity on the BTC blockchain has been on the decline. Generally, user interest keeps rallies fueled, so an increase in Active Addresses is needed to keep any more sustainable.
As investors are starting to pay less attention to the cryptocurrency, conditions may not be right for a bull run anymore. The chart shows that this kind of crossover also occurred at the end of the bull run in the first half of 2021, although the second-half rally did occur regardless.
The second momentum indicator is the famous Market Value to Realized Value (MVRV) Ratio, which tells us whether the investors are in profit or loss.
As the chart shows, the MVRV Ratio has also seen its monthly cross below its yearly, suggesting investor profits have been shrinking. This pattern has historically served as a death cross, with BTC shifting towards a bearish phase following it. The same cross also appeared just before the 2022 bear market kicked off.
Finally, there is also the bearish crossover between the 50-day and 200-day MAs of the Bitcoin price itself.
Given all these negative patterns across the different Bitcoin indicators, the cryptocurrency may be heading towards at least a short-term bearish period.
BTC PriceBitcoin has struggled recently as its price has dipped towards the $56,500 level.
Why this matters
This bitcoin story adds another data point to the current market tape and is useful when read alongside nearby source coverage.
Original source
Read on NewsBTCRelated market context
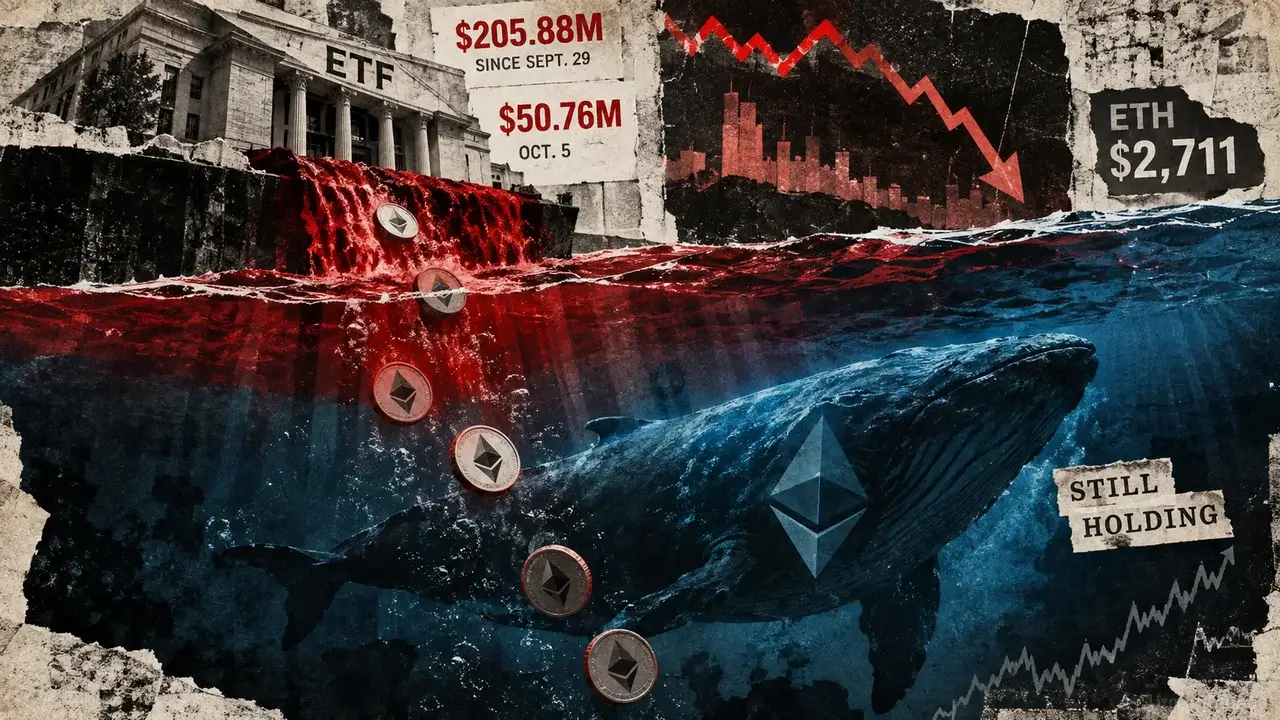
Ethereum bears keep selling but ETH price stays near $2,700 as US spot ETFs record $206M in outflows
Ethereum’s institutional demand is weakening around the same time derivatives positioning shows traders are selling aggressively w...

Ethereum’s proposed 3x ETF could reach CME’s futures threshold with just $362 million
At ETHU's Oct. 6 disclosed futures valuation, a 3x Ethereum ETF with $362.1 million in assets would target about $1.09 billion of...

Ethereum Price Prediction: Last-Minute Glamsterdam Fix Sets Stage for 200M Gas Jump
Ethereum trades at just under $2,700 as validators prepare for Glamsterdam’s Sepolia activation, which could lift its price predic...

Microsoft Copilot AI Predicts Chainlink (LINK) Could Hit $100 in 2026
Microsoft Copilot AI predicts that in a world where Chainlink becomes the backbone of a major global settlement system, such as SW...

OKX Gets New Funding From Circle, Standard Chartered at $25B Valuation
Bitcoin Magazine OKX Gets New Funding From Circle, Standard Chartered at $25B Valuation Crypto exchange OKX has raised new funding...

Now Accepting Bitcoin: Buy Coffee and Bacon Across 200 Indiana Bitcoin Merchants
Bitcoin Magazine Now Accepting Bitcoin: Buy Coffee and Bacon Across 200 Indiana Bitcoin Merchants Table of ContentsFirst Up: Old M...