Bitcoin Nears Death Cross That Preceded Final Bear Market Legs
An analyst has pointed out how Bitcoin could be approaching a death cross between the 50-day and 200-day SMAs on the 3-day chart. Bitcoin Is Potentially Nearing A Death Cross On The 3-Day Timeframe In a new post on X, an...
Archive context
Older archive item. Useful for background and entity history, but not a fresh market-moving signal.

An analyst has pointed out how Bitcoin could be approaching a death cross between the 50-day and 200-day SMAs on the 3-day chart.
Bitcoin Is Potentially Nearing A Death Cross On The 3-Day TimeframeIn a new post on X, analyst Ali Martinez has talked about a death cross on Bitcoin’s 3-day price chart. A “death cross” popularly refers to a bearish signal produced by a crossover between two simple moving averages (SMAs) of an asset. Typically, a death cross involves the longer SMA moving above the shorter one. In the context of the current topic, the SMAs of relevance are the 50-day and 200-day versions.
Below is the chart shared by Martinez that shows the pattern displayed by these two SMAs for the 3-day Bitcoin price.
As is visible in the graph, the 50-day SMA of the 3-day Bitcoin price saw a cross under the 200-day SMA in each of the last three cycles. All of these crossovers preceded bearish price action.
More specifically, the 2014 crossover led to a drawdown of 52.19% for the asset, the 2018 one to 50.56%, and the 2022 one to 45.91%. Interestingly, these price declines all led to the bottoms of their respective bear markets. “Since 2014, the death cross between the 50 and 200 simple moving averages on the 3-day chart has consistently preceded the final leg down of a Bitcoin $BTC bear market,” noted the analyst.
Jumping to the present, BTC has faced a bearish shift in recent months with a notable drawdown in its price. This has resulted in the 50-day SMA witnessing a decline toward the 200-day SMA. As a zoomed-in chart shared by Martinez in another X post shows, there is now not much distance left between the 50-day and 200-day SMAs of the 3-day Bitcoin price.
If the two lines continue to follow the current trajectories, the analyst has estimated that a death cross could occur on February 27th. Given the past trend, such a death cross could take Bitcoin into its final leg for the bear market. It only remains to be seen, however, whether the current cycle will actually follow a similar pattern or if it will show divergence.
In some other news, the Realized Profit/Loss Ratio has slipped into the loss region recently, as on-chain analytics firm Glassnode has highlighted in an X post.
In the past, a shift toward loss realization on the Bitcoin network has generally lasted for over six months before a return of liquidity has occurred.
BTC PriceBitcoin has erased some of its recent recovery over the past couple of days as its price is now trading around $63,300.
Why this matters
Bitcoin is a tracked market entity in the DigitalMoneyBox archive, making this useful context for readers monitoring repeated mentions and follow-up coverage.
Original source
Read on NewsBTCRelated market context
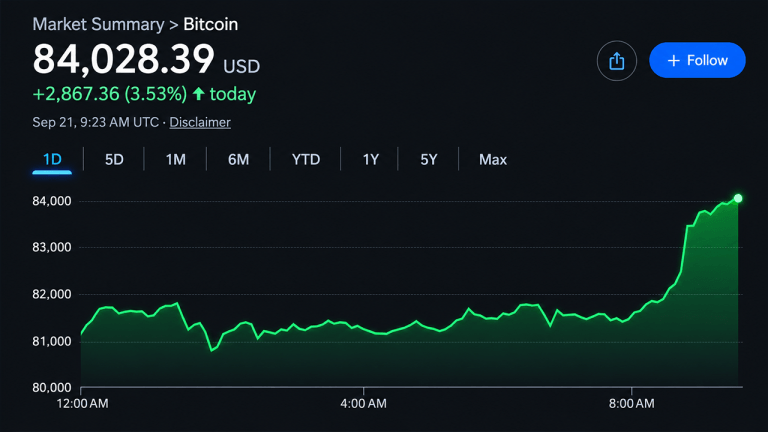
Bitcoin Price Crosses $84,000 as Analysts Declare Bear Market Over
Bitcoin’s price crossed the $84,000 mark early Monday morning after closing the week above its 50-week moving average for the firs...

Bitcoin Price Prediction: Has the BTC Bear Market Ended After 45 Weeks?
Bitcoin is trading at $81,600, up by a huge 6% since the start of last week, and the number that matters for its price prediction...

Bitcoin (BTC) Price Today: BTC Breaks $85K Resistance as Bulls Defend $80K Support
BTC traded around $85,311 in the technical analysis referenced for this report, while the broader market move also lifted Bitcoin...

Bitcoin Bull Market Engaged? 50-Week Moving Average Flips Bullish
Bitcoin Magazine Bitcoin Bull Market Engaged? 50-Week Moving Average Flips Bullish Bitcoin just closed a weekly candle above its 5...

XRP News: AI Payments Integration With Stripe Driving Ripple Toward $1.50
In XRP news, the asset is moving faster than it has since August. The token passed $1.38 on CoinGecko after a +2% gain over the pa...

Ethereum (ETH) Price Prediction: ETH Breaks Higher as $2,631 Support Puts $3,520 Target in Focus
Ethereum price is showing renewed bullish momentum after climbing above $2,650, with ETH trading near $2,667 and gaining approxima...