Bitcoin Poised for a 200% Rally as Analyst Spot Rare Bullish Pattern
Amid Bitcoin’s current gradual recovery in price, attention has been drawn towards the asset as it prepares to be on the verge of closing its seventh consecutive monthly candle above the all-time high (ATH) of 2021. Reno...
Archive context
Older archive item. Useful for background and entity history, but not a fresh market-moving signal.

Amid Bitcoin’s current gradual recovery in price, attention has been drawn towards the asset as it prepares to be on the verge of closing its seventh consecutive monthly candle above the all-time high (ATH) of 2021.
Renowned crypto analyst Moustache recently took to X to highlight this key milestone, emphasizing the importance of higher timeframes in trading.
According to Moustache, the fact that Bitcoin is holding above its previous ATH every month is a strong indicator of support, which could signal continued upward momentum shortly.
Is Bitcoin Building Momentum For A Big Move?Mustache’s analysis noted, “Can everyone see what’s happening here? BTC is about to close its SEVENTH monthly candle above the ATH of 2021. The higher the timeframe, the stronger the support. That’s bullish [to be honest].”
This statement highlights the significance of long-term support levels in his BTC outlook. Notably, in trading, when an asset consistently closes above a previous peak on higher timeframes, it often indicates that the market is forming a solid foundation for future growth.
This observation is particularly relevant for Bitcoin, which has historically exhibited strong price movements following extended periods of consolidation and support-building.
While Bitcoin’s sustained support above its previous ATH is a positive sign, another technical indicator also highlighted by the same analysts: the Bollinger Band Width Percentile (BBWP).
BBWP Indicator Signals 200% Rally AheadIn a recent post, Moustache pointed out that the BBWP on Bitcoin’s 2-week (2W) chart signals the emergence of blue bars, a rare occurrence only seen once in Bitcoin’s history.
The BBWP is a tool used in technical analysis to measure the width of the Bollinger Bands, which are volatility indicators that reflect the range of an asset’s price movement. The blue bars in the BBWP indicate a period of low volatility, which often precedes significant price swings.
Moustache explained the implications of this signal, disclosing that the last time the BBWP signaled multiple blue bars on the 2W-Chart of BTC, BTC saw almost a 200% upward move.
“Incidentally, this is only the second time we’ve seen blue bars in the BBWP. This has never happened before in history,” Moustache noted. This observation suggests that Bitcoin could be on the cusp of a major price movement, with the potential for significant gains if the historical pattern holds.
Notably, the BBWP’s indication of low volatility aligns with the concept that markets often experience a surge in price action following periods of calm. In Bitcoin’s case, the current environment of subdued volatility, as indicated by the blue bars, may be setting the stage for a significant price breakout.
Featured image created with DALL-E, Chart from TradingView
Why this matters
This bitcoin story adds another data point to the current market tape and is useful when read alongside nearby source coverage.
Original source
Read on NewsBTCRelated market context

Non-Custodial Crypto Exchanges: How Self-Custody Is Changing the Way Users Swap Digital Assets
For many users, the distinction comes down to custody. A centralized platform may hold assets on behalf of its customers, while a...

Google Gemini AI Predicts Chainlink (LINK) to Hit $300 by 2027
Google Gemini AI predicts that, assuming a full-blown crypto bull market returns and is turbocharged by a landmark catalyst, LINK...
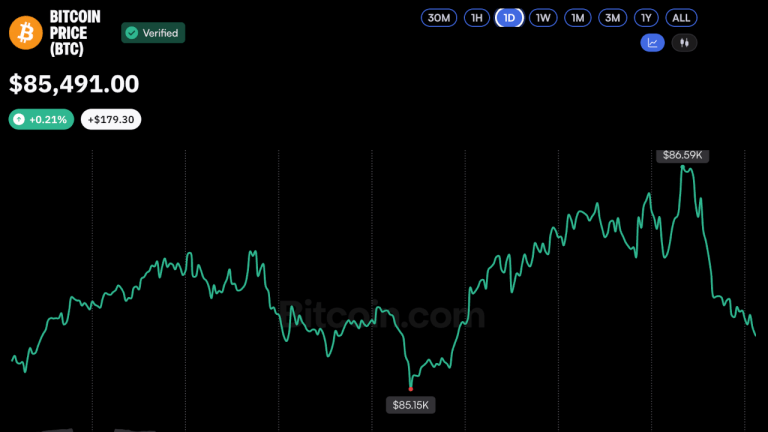
Bitcoin Price Holds October Gains After Two Surges Above $86K
Bitcoin twice rose above $86,000 on Tuesday, supported by momentum from the CFTC’s proposed cryptocurrency regulations and a recen...

Ripple and Circle backs OKX as it targets the next wave of stablecoin users
OKX brought Circle, Ripple and Standard Chartered’s venture arm onto its cap table as the crypto exchange broadens its push into s...
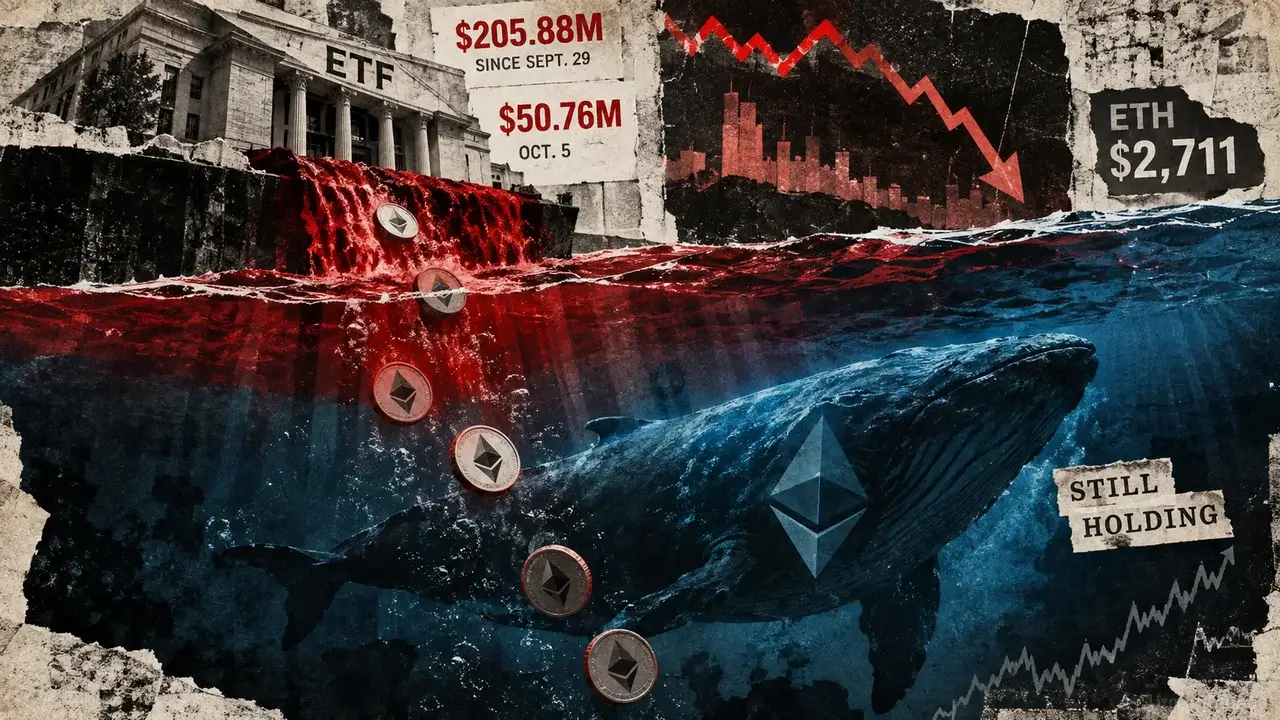
Ethereum bears keep selling but ETH price stays near $2,700 as US spot ETFs record $206M in outflows
Ethereum’s institutional demand is weakening around the same time derivatives positioning shows traders are selling aggressively w...

SEC drops to 2 members, and 1 hidden rule shifts crypto power
Hester Peirce’s Oct. 2 resignation has left Paul Atkins and Mark Uyeda as the SEC’s two listed commissioners. A new rule permits o...