Bitcoin Price Action Falls Flat | BTCUSD Analysis October 18, 2022
In this episode of NewsBTC’s daily technical analysis videos, we are once again examining a possible expanded flat correction in Bitcoin. Once the correction has completed, the bull market could resume. Take a look at th...
Archive context
Older archive item. Useful for background and entity history, but not a fresh market-moving signal.

In this episode of NewsBTC’s daily technical analysis videos, we are once again examining a possible expanded flat correction in Bitcoin. Once the correction has completed, the bull market could resume.
Take a look at the video below:
VIDEO: Bitcoin Price Analysis (BTCUSD): October 18, 2022In addition to the video highlights listed below the video, we also analyze BTCUSD using the Ichimoku, Bollinger Bands, SuperTrend, TD Sequential, and other technical tools.
Three Strikes: BTCUSD Rejected From 50-Day Moving AverageBTCUSD daily price action was once again rejected from the 50-day moving average. This is the third rejection since September, making the 50MA a critical line in the sand to pass before any chance of further upside.
Zooming out and comparing the 50MA and its behavior around the 2018 bear market bottom, we can see that breaking through it is the key to bulls regaining control on daily timeframes. Given the close proximity of the 100-day moving average in yellow, the next target would be the red, 200-day moving average located at around $26K.
If Bitcoin can break the 50-MA and 100-MA, $26K is next | Source: BTCUSD on TradingView.com Bitcoin CME Futures Paints Near-Perfect Expanded Flat PatternThe BTC CME Futures line chart causes the price action over the last 18 months to nearly perfectly fill out an expanded flat pattern. An expanded flat features a higher high at the top of the B wave, followed by a lower low as the C wave terminates. The C wave is an impulse wave down made up of 5 total sub-waves.
The BTC CME chart begins with a bear market. The primary count would suggest the expanded flat correction formed in wave 4 and there is still a wave 5 ahead. In Elliott Wave Theory, one way to possibly project the peak of where wave 5 will terminate, is to find the inverse Fibonacci extension of wave C.
At the 1.272 extension, Bitcoin would reach $90,000, while if the 1.618 golden ratio extension is tapped, the top would be over $137,000 per BTC.
Could this be the correction that has cut down crypto prices? | Source: BTCUSD on TradingView.comRelated Reading: Bitcoin Price Bounces After CPI Dump | BTCUSD Analysis October 13, 2022
Will The Crypto Winter Conclude With A Touch Of The Log Growth Curve?Although given the macro sentiment, the risk of recession, and the fact each floor in crypto has fallen out again and again, this is not an unusual place for Bitcoin to bottom out.
Bitcoin price continues to grind along the logarithmic growth curve. All price action throughout the entire history of cryptocurrencies has been contained within this narrowing curvature. Why would it suddenly stop now?
BTC is brushing against the bottom of the log curve | Source: BTCUSD on TradingView.comLearn crypto technical analysis yourself with the NewsBTC Trading Course. Click here to access the free educational program.
Follow @TonySpilotroBTC on Twitter or join the TonyTradesBTC Telegram for exclusive daily market insights and technical analysis education. Please note: Content is educational and should not be considered investment advice.
Featured image from iStockPhoto, Charts from TradingView.comWhy this matters
This bitcoin story adds another data point to the current market tape and is useful when read alongside nearby source coverage.
Original source
Read on NewsBTCRelated market context
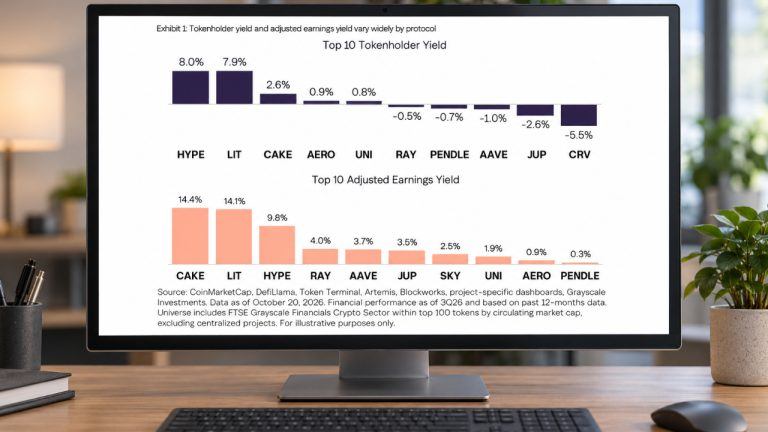
Grayscale Warns Crypto Token Inflation Can Wipe Out Holder Rewards
Crypto applications can generate earnings, yet growing token supplies can reduce the benefits reaching holders. Grayscale’s new an...

Pump.fun surpasses Hyperliquid in daily revenue with $2M in 24 hours
Pump.fun's revenue surge underscores memecoin sector's growing influence, potentially reshaping decentralized finance dynamics and...

Ethereum (ETH) Price Prediction: Whale Rotates $155M Into ETH as Longs Surge Near $2,500
Ethereum is trying to stabilize after another volatile stretch, with price returning toward the mid-$2,400 region while several po...

Solana outshines XRP with higher transactions and stablecoin usage: Motley Fool
Solana's superior network metrics and stablecoin usage may boost investor confidence, potentially impacting its market valuation a...

Phantom Starts a Staged US Launch of In-Wallet Prediction Markets
US users of Phantom can now trade prediction markets in the wallet, under a staged launch that began Friday and runs through Kalsh...

Ether ETFs Are Having Their Worst Month of 2026. Who Buys Once Bitmine Stops?
Ether’s (ETH) demand this year has largely come from two places: spot exchange-traded funds (ETFs) and Bitmine Immersion Technolog...