Bitcoin Price Attempts Comeback, but Technical Hurdles Challenge Bulls Ahead
Bitcoin price failed to stay above $65,000 and dipped further. BTC is now recovering losses from $62,500 and faces hurdles near the $66,500 zone. Bitcoin started a fresh decline and traded below the $65,000 support. The...

Bitcoin price failed to stay above $65,000 and dipped further. BTC is now recovering losses from $62,500 and faces hurdles near the $66,500 zone.
- Bitcoin started a fresh decline and traded below the $65,000 support.
- The price is trading below $66,500 and the 100 hourly simple moving average.
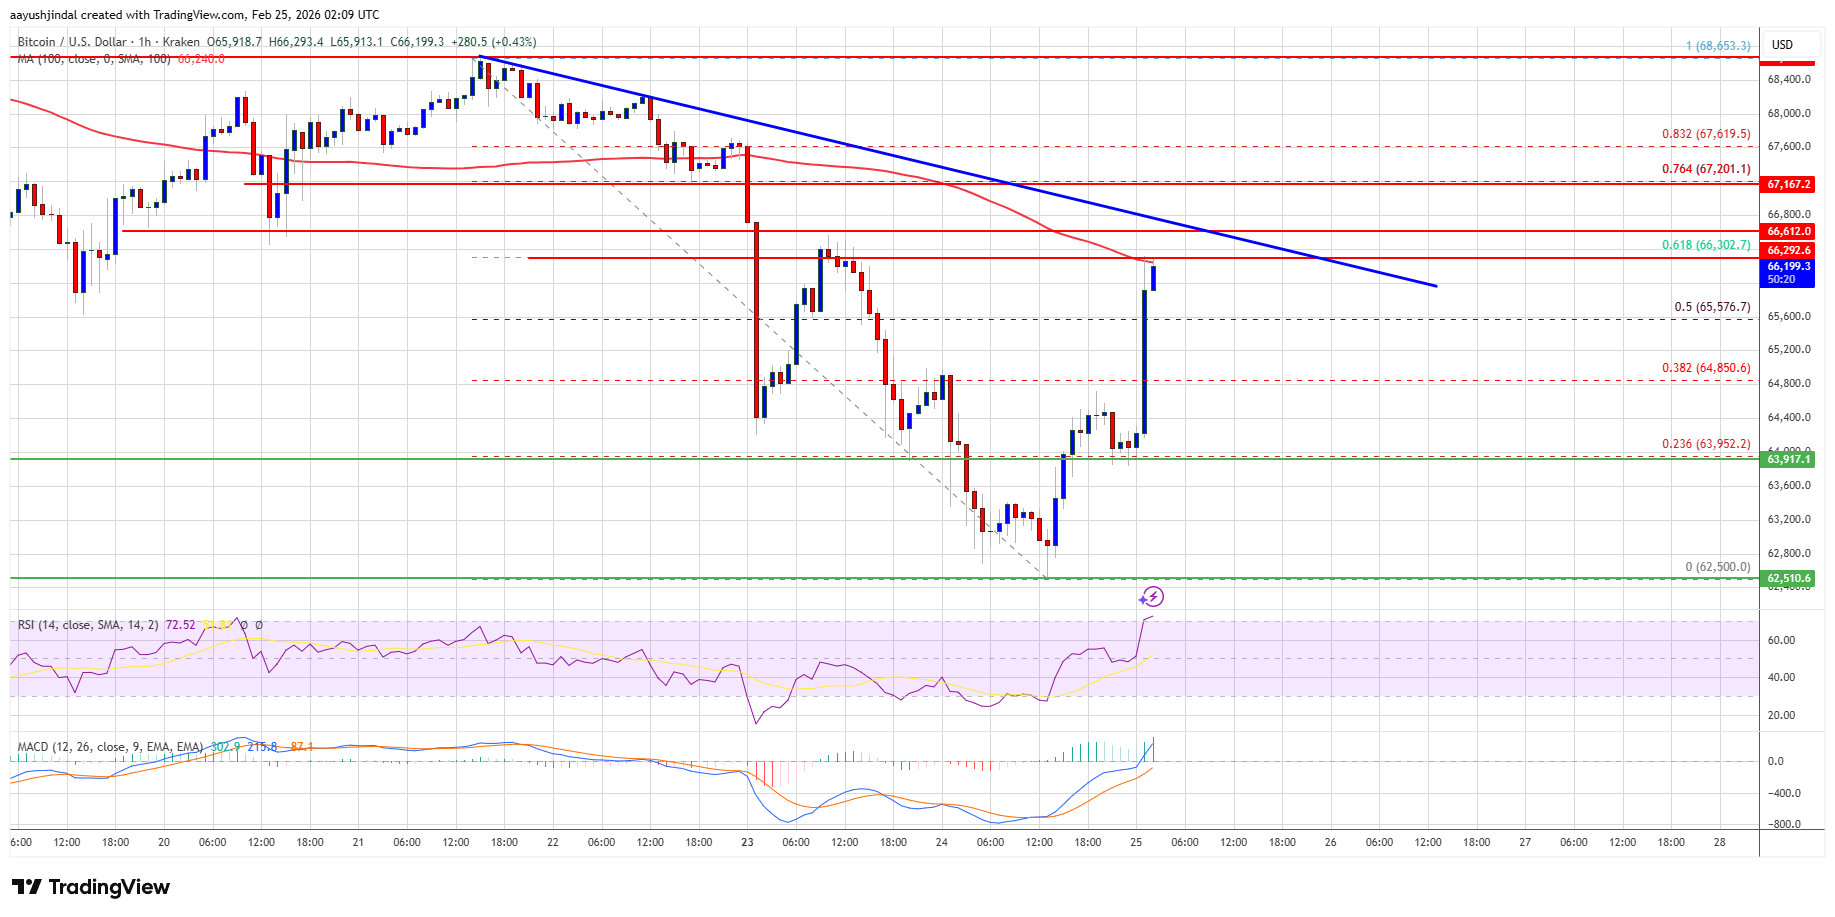
- There is a bearish trend line forming with resistance at $66,600 on the hourly chart of the BTC/USD pair (data feed from Kraken).
- The pair might dip again if it trades below the $65,500 and $65,000 levels.
Bitcoin price failed to remain stable above the $66,000 zone. BTC started a fresh decline and traded below the $65,000 support zone. There was a push below $64,000.
The price even spiked below $63,000. A low was formed at $62,500, and the price is now correcting some losses. There was a move above $65,000 and the 50% Fib retracement level of the recent decline from the $68,654 swing high to the $62,500 low.
Bitcoin is now trading below $66,500 and the 100 hourly simple moving average. If the price remains stable above $65,000, it could attempt a fresh increase. Immediate resistance is near the $66,500 level. There is also a bearish trend line forming with resistance at $66,600 on the hourly chart of the BTC/USD pair.
The first key resistance is near the $67,200 level or the 76.4% Fib retracement level of the recent decline from the $68,654 swing high to the $62,500 low. A close above the $67,200 resistance might send the price further higher. In the stated case, the price could rise and test the $68,000 resistance. Any more gains might send the price toward the $68,800 level. The next barrier for the bulls could be $69,200 and $69,500.
Another Decline In BTC?If Bitcoin fails to rise above the $66,500 resistance zone, it could start another decline. Immediate support is near the $65,500 level. The first major support is near the $65,000 level.
The next support is now near the $64,200 zone. Any more losses might send the price toward the $63,500 support in the near term. The main support now sits at $62,500, below which BTC might struggle to recover in the near term.
Technical indicators:
Hourly MACD – The MACD is now gaining pace in the bullish zone.
Hourly RSI (Relative Strength Index) – The RSI for BTC/USD is now above the 50 level.
Major Support Levels – $65,500, followed by $65,000.
Major Resistance Levels – $66,500 and $67,200.
Original source
Read on NewsBTCRelated market context

Ethereum Nears 200 Million Non-Empty Wallets Despite Market Uncertainty
Despite persistent market uncertainty and bearish sentiment across parts of the cryptocurrency sector, Ethereum is approaching a s...

Kraken Adds USDCx Support On Canton As Institutional Stablecoin Rails Expand
TL;DR Kraken says it now supports USDCx deposits and withdrawals on the Canton Network. USDCx is described as a Canton-native stab...

Kraken Becomes Official Crypto Exchange Supporter Of FIFA World Cup 2026
TL;DR Kraken says it has become the Official Crypto Exchange Supporter of the FIFA World Cup 2026. The tournament expands to 48 te...

Ethereum Price Prediction: 3 Million ETH Rushes Into Staking as Sellers Vanish
Is nobody leaving Ethereum? A record 36 million ETH is now locked in staking, roughly 29–30% of the circulating supply, and the va...

Ethereum Futures Just Hit A Binance Record: Are Traders Calling The Bottom?
Ethereum derivatives activity is flashing a fresh signal on Binance, where open interest measured in ETH terms has reached a new a...

XRP aims for $0.90 as ETF demand battles selling pressure from whales
XRP is trading at $1.11, down roughly 17% from its June opening, having set a new 2026 low on June 5 and shed $8 billion in market...