Bitcoin Price Back Under Pressure After Recovery Hopes Fade
Bitcoin price started a downside correction from the $64,600 zone. BTC is showing bearish signs and might continue lower below $61,200. Bitcoin failed to stay above $64,000 and extended losses. The price is trading below...
Archive context
Older archive item. Useful for background and entity history, but not a fresh market-moving signal.

Bitcoin price started a downside correction from the $64,600 zone. BTC is showing bearish signs and might continue lower below $61,200.
- Bitcoin failed to stay above $64,000 and extended losses.
- The price is trading below $62,800 and the 100 hourly simple moving average.
- There was a break below a bullish trend line with support at $62,500 on the hourly chart of the BTC/USD pair (data feed from Kraken).
- The pair might extend losses if it stays below the $62,500 and $62,200 levels.
Bitcoin price failed to clear the $64,500 resistance zone. BTC started a downside correction and declined below the key support at $63,500 to enter a bearish zone.
There was a move below the 50% Fib retracement level of the upward move from the $59,070 swing low to the $64,613 high. Besides, there was a break below a bullish trend line with support at $62,500 on the hourly chart of the BTC/USD pair.
Bitcoin is now trading below $62,500 and the 100 hourly simple moving average. If the price remains stable above $61,500, it could attempt a fresh increase. Immediate resistance is near the $62,000 level. The first key resistance is near the $62,200 level.
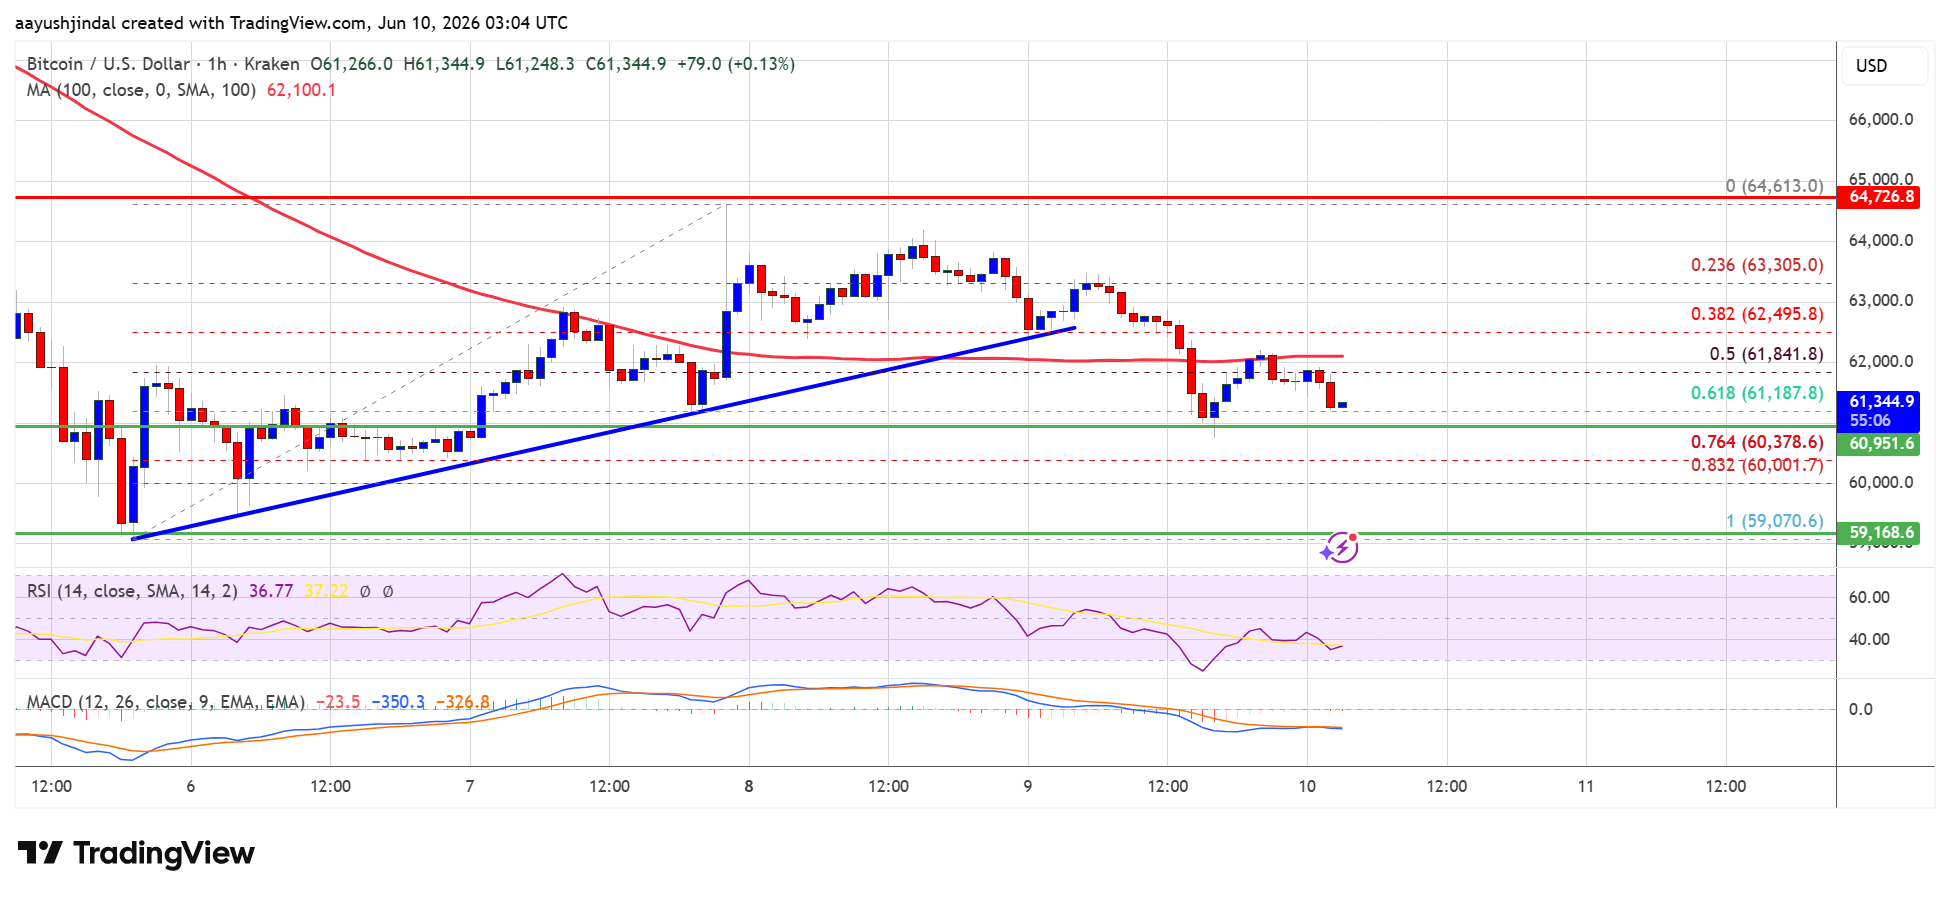
A close above the $62,200 resistance might send the price further higher. In the stated case, the price could rise and test the $64,000 resistance. The next resistance could be near the $64,500 level. Any more gains might send the price toward the $66,000 level. The main hurdle for the bulls could be $66,500.
Downside Extension In BTC?If Bitcoin fails to rise above the $62,500 resistance zone, it could start another decline. Immediate support is near the $61,200 level or the 61.8% Fib retracement level of the upward move from the $59,070 swing low to the $64,613 high.
The first major support is near the $60,950 level. The next support is now near the $60,200 zone. Any more losses might send the price toward the $59,000 support in the near term. The main support now sits at $58,500, below which BTC might struggle to recover in the near term.
Technical indicators:
Hourly MACD – The MACD is now gaining pace in the bearish zone.
Hourly RSI (Relative Strength Index) – The RSI for BTC/USD is now below the 50 level.
Major Support Levels – $61,200, followed by $60,200.
Major Resistance Levels – $62,500 and $64,000.
Why this matters
Bitcoin is a tracked market entity in the DigitalMoneyBox archive, making this useful context for readers monitoring repeated mentions and follow-up coverage.
Original source
Read on NewsBTCRelated market context

Why Is XRP Down Today? Bears Target $1.30 Support as Selling Pressure Builds
The downturn has weakened XRP’s short-term technical structure, leaving traders focused on whether buyers can defend nearby suppor...

Ethereum (ETH) Price Prediction: ETH Holds Near $2,500 as ETF Flows Turn Positive and Long Positions Reach Four-Year High
Ethereum is holding close to $2,500 after a volatile start to October, with the market now showing a mixture of improving institut...

Bitcoin (BTC) Price Prediction: Slowing Whale Selling Offers Hope as $81.5K ETF Support Holds
On-chain data indicates that distribution from longer-term holders has slowed, offering some relief to the market. However, weaken...
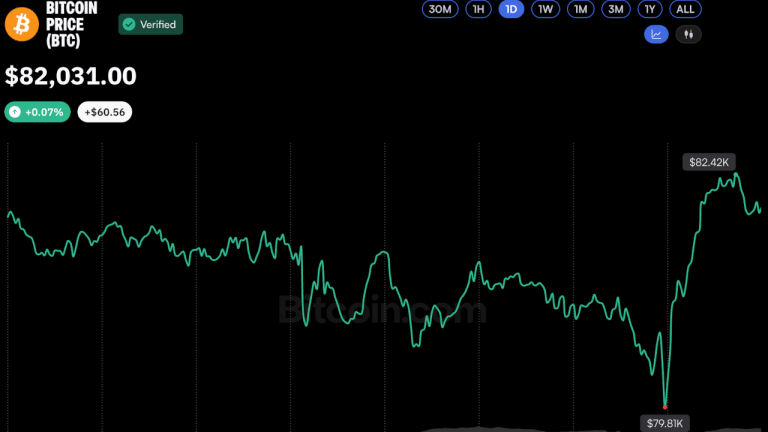
Bitcoin Price Rebounds Above $82K After Brief Dip Below $80K
Bitcoin staged a rapid recovery Thursday, climbing back above $82,000 to trade slightly higher over 24 hours with a market cap nea...

XRP Price Prediction: Evernorth’s $648M Game Plan Takes Shape
XRP trades at $1.30, down 6% over 24 hours, as traders weigh sticky U.S. inflation against a major institutional treasury plan. Ev...

Ethereum Price Prediction: ETH Bears Take Over in Latest Liquidation Bloodbath
Ethereum traded at $2,350, losing 6.5% of its market cap over 24 hours, after a liquidation-driven sell-off exposed how quickly le...