Bitcoin Price Bounces Past 105K: Is a Full-Blown Rally Back on the Cards?
Bitcoin price started a recovery wave above the $105,000 zone. BTC is now consolidating and might attempt to clear the $106,500 resistance. Bitcoin started a recovery wave above the $105,000 zone. The price is trading ab...
Archive context
Older archive item. Useful for background and entity history, but not a fresh market-moving signal.

Bitcoin price started a recovery wave above the $105,000 zone. BTC is now consolidating and might attempt to clear the $106,500 resistance.
- Bitcoin started a recovery wave above the $105,000 zone.
- The price is trading above $105,000 and the 100 hourly Simple moving average.
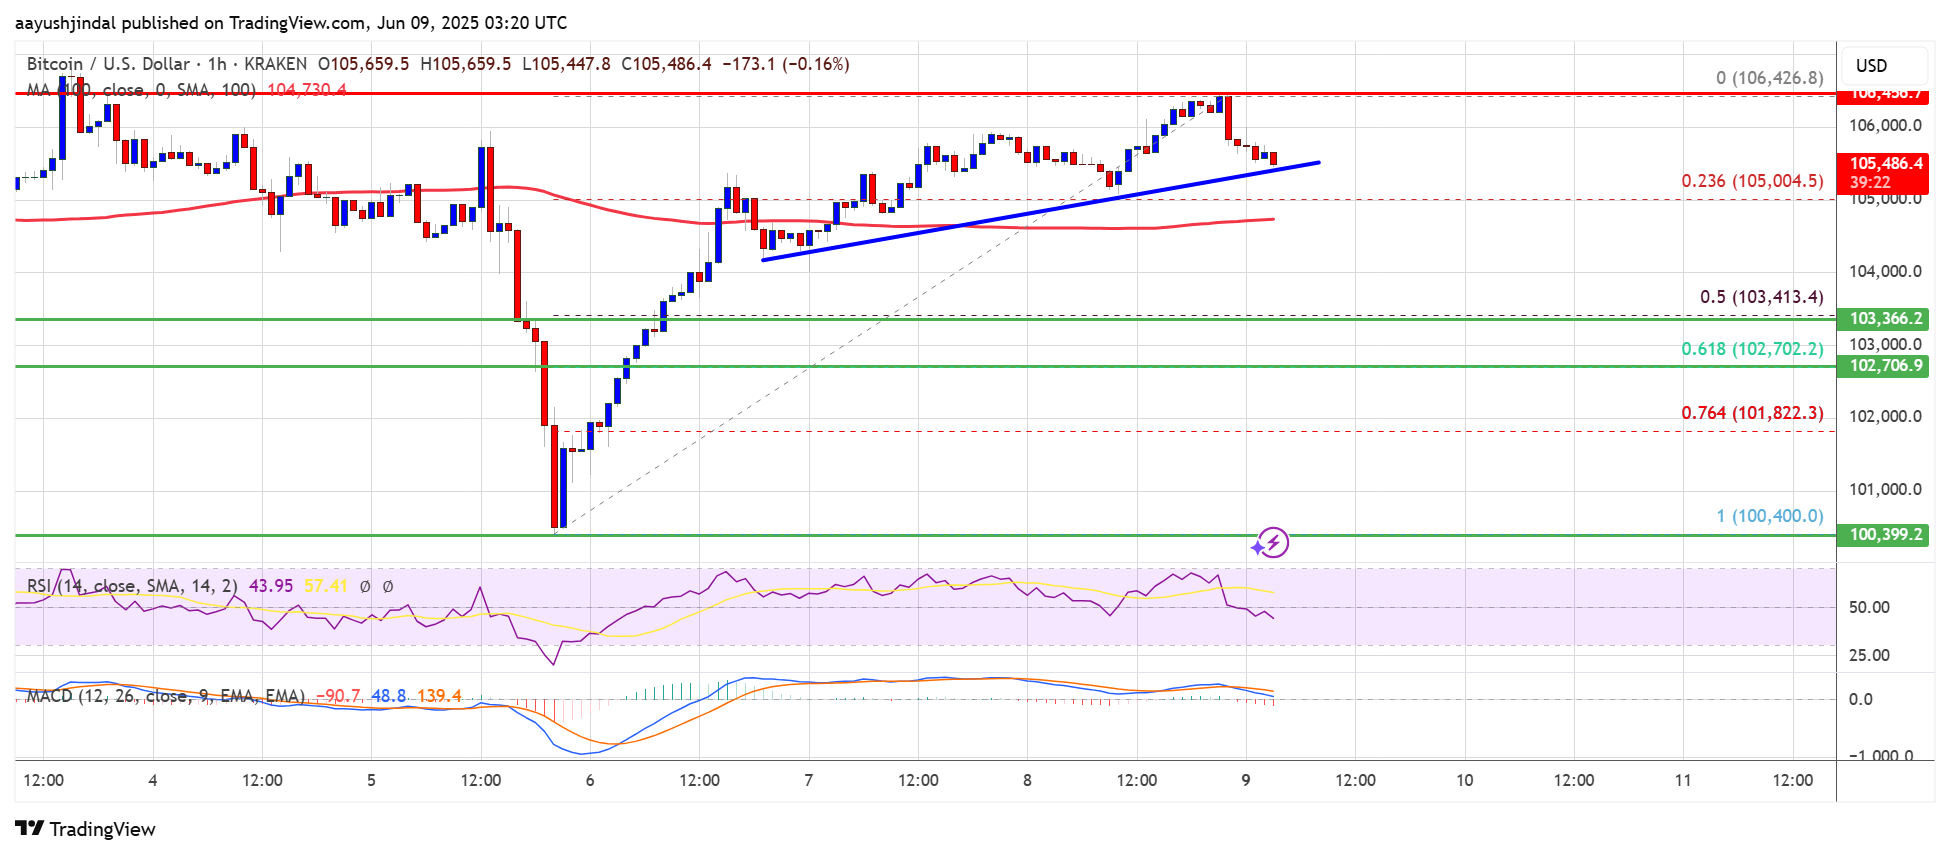
- There is a bullish trend line forming with support at $105,350 on the hourly chart of the BTC/USD pair (data feed from Kraken).
- The pair could start a fresh decline if it breaks the $104,000 support zone.
Bitcoin price started a fresh decline and traded below the $102,500 support zone. BTC even traded close to the $100,000 zone before the bulls appeared.
A low was formed and the price recovered above the $103,500 resistance. The bulls even pushed the price above the $105,000 resistance. A high was formed at $106,426 and the price is now consolidating gains above the 23.6% Fib retracement level of the upward move from the $100,400 swing low to the $106,426 high.
Bitcoin is now trading above $105,000 and the 100 hourly Simple moving average. There is also a bullish trend line forming with support at $105,350 on the hourly chart of the BTC/USD pair.
On the upside, immediate resistance is near the $106,200 level. The first key resistance is near the $106,500 level. The next key resistance could be $107,600. A close above the $107,600 resistance might send the price further higher. In the stated case, the price could rise and test the $108,800 resistance level. Any more gains might send the price toward the $110,000 level.
Another Decline In BTC?If Bitcoin fails to rise above the $106,200 resistance zone, it could start another decline. Immediate support is near the $105,200 level and the trend line. The first major support is near the $103,500 level and the 50% Fib retracement level of the upward move from the $100,400 swing low to the $106,426 high.
The next support is now near the $102,000 zone. Any more losses might send the price toward the $100,500 support in the near term. The main support sits at $100,000, below which BTC might gain bearish momentum.
Technical indicators:
Hourly MACD – The MACD is now gaining pace in the bullish zone.
Hourly RSI (Relative Strength Index) – The RSI for BTC/USD is now above the 50 level.
Major Support Levels – $105,200, followed by $103,500.
Major Resistance Levels – $106,200 and $107,600.
Why this matters
This bitcoin story adds another data point to the current market tape and is useful when read alongside nearby source coverage.
Original source
Read on NewsBTCRelated market context

David Schwartz Regrets Selling XRP at 10 Cents as Price Broke $1.10 Resistance
Ripple CTO Emeritus David Schwartz just reminded the market why conviction is the hardest edge to hold. XRP price is trading aroun...

Bitcoin (BTC) Price Prediction: Can Bitcoin Break $67K as Wyckoff Re-Accumulation Hints at an $85K Rally?
The rebound has improved the short-term technical picture, but the Bitcoin price still faces several important hurdles before the...

Bitcoin Price Prediction: Now, $70K is the Target
Bitcoin is trading at just a nod above $66,000 after a 3% rally since yesterday morning, with price prediction pointing at a $70K...

Institutional ETF Inflows Push Bitcoin Past $66K as LiquidChain Presale Nears $1M
On Tuesday, July 21, 2026, institutional capital showed sustained momentum as Bitcoin (BTC) climbed back above $66,000. This recov...

Ethereum Price Prediction: Arthur Hayes Makes $25M Move as ETH Tests $2K
Arthur Hayes is buying Ethereum again, trading above $1,900, as its price prediction centers around the psychological $2,000 level...

Ethereum News: BlackRock’s ETHA Drives ETH ETF Reversal With Back-to-Back Inflow Weeks
In Ethereum news today, spot ETFs recorded $105M in net inflows during the week of July 13–17, 2026, the strongest weekly figure s...