Bitcoin Price Breaks Higher, Is the Rally Just Getting Started?
Bitcoin price is gaining pace above the $26,700 resistance. BTC is consolidating above $26,800 and might continue to rise above the $27,200 resistance. Bitcoin gained pace above the $26,500 and $26,700 resistance levels....
Archive context
Older archive item. Useful for background and entity history, but not a fresh market-moving signal.

Bitcoin price is gaining pace above the $26,700 resistance. BTC is consolidating above $26,800 and might continue to rise above the $27,200 resistance.
- Bitcoin gained pace above the $26,500 and $26,700 resistance levels.
- The price is trading above $26,700 and the 100 hourly Simple moving average.
- There is a key bullish trend line forming with support near $26,800 on the hourly chart of the BTC/USD pair (data feed from Kraken).
- The pair could accelerate higher above the $27,200 resistance zone.
Bitcoin price remained stable above the $26,000 support zone. BTC formed a base and started a steady increase above the $26,500 resistance zone.
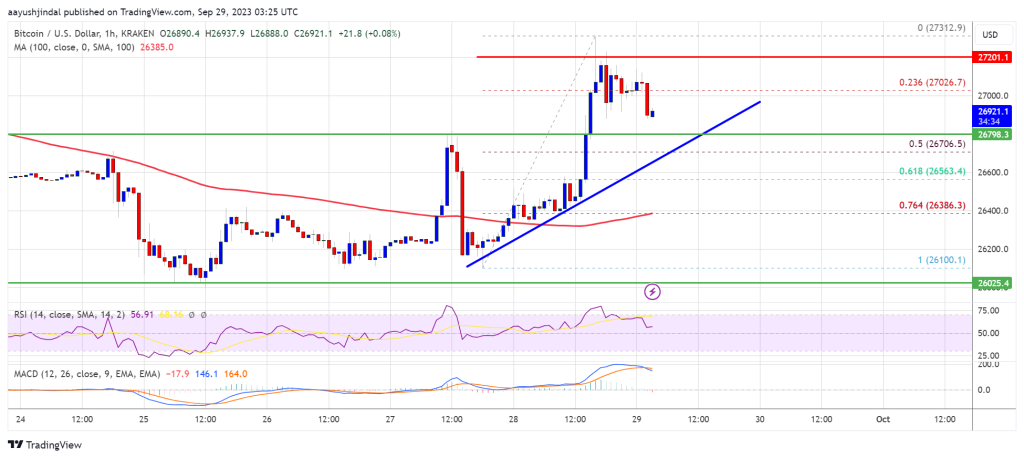
The bulls finally managed to pump the price above the $26,700 resistance. It even spiked above the $27,200 level. A high is formed near $27,312 and the price is now consolidating gains. There was a minor decline below the 23.6% Fib retracement level of the upward move from the $26,100 swing low to the $27,312 high.
Bitcoin is trading above $26,700 and the 100 hourly Simple moving average. There is also a key bullish trend line forming with support near $26,800 on the hourly chart of the BTC/USD pair.
Source: BTCUSD on TradingView.com
Immediate resistance on the upside is near the $27,200 level. The next key resistance could be near the $27,500 level. A close above the $27,500 resistance could send the price further higher. In the stated case, the price could climb toward the $28,200 resistance. Any more gains might call for a move toward the $28,500 level.
Are Dips Limited In BTC?If Bitcoin fails to continue higher above the $27,200 resistance, there could be a downside correction. Immediate support on the downside is near the $26,800 level and the trend line.
The next major support is near the $26,500 level or the 50% Fib retracement level of the upward move from the $26,100 swing low to the $27,312 high. A downside break and close below the $26,500 level might start another major decline. The next support sits at $26,000. Any more losses might call for a test of $25,400.
Technical indicators:
Hourly MACD – The MACD is now losing pace in the bullish zone.
Hourly RSI (Relative Strength Index) – The RSI for BTC/USD is now above the 50 level.
Major Support Levels – $26,800, followed by $26,500.
Major Resistance Levels – $27,200, $27,500, and $28,000.
Why this matters
This bitcoin story adds another data point to the current market tape and is useful when read alongside nearby source coverage.
Original source
Read on NewsBTCRelated market context

XRP Price Prediction: Analyst Maps Rally to $2.55 as Macro Accumulation Zone Holds
While current market indicators point to limited momentum, several chart analysts argue that the XRP price remains within a histor...

Bitcoin (BTC) Price Prediction: $65K Remains Key Resistance as 4-Year Cycle Model Signals Make-or-Break Moment
The Bitcoin price today remains around $62,600-$62,900, according to TradingView data, reflecting a market that has stabilized fol...

Ethereum Price Prediction: Tom Lee Predicts $5 Trillion Ethereum
Ethereum price prediction is back in focus after Fundstrat co-founder Tom Lee floated a $5 trillion network valuation. ETH trades...

Litecoin (LTC) Price Prediction: Mixed Technical Signals and Growing Hashrate Keep Traders Focused on $39 Support and $46 Breakout
Analysts are closely watching whether the Litecoin price can maintain support around $39 and break above the key $46 resistance le...

Dogecoin Traders Watch $0.13 As DOGE Reclaims A Key Technical Level
Dogecoin Traders Watch $0.13 as DOGE Reclaims A Key Technical Level is the kind of crypto story that looks simple at headline leve...

Ethereum Foundation AI Agent Research Shows Where Smart Contracts May Be Heading Next
Ethereum Foundation AI Agent Research Shows Where Smart Contracts May Be Heading Next is the kind of crypto story that looks simpl...