Bitcoin Price: Can Cyclical Tools Predict The Next Bubble? | BTCUSD November 7, 2022
In this episode of NewsBTC’s daily technical analysis videos, we examine major Bitcoin price troughs with Hurst Cycle Theory and cyclical tools to consider if the bottom could be in and if another bubble is coming. Take...
Archive context
Older archive item. Useful for background and entity history, but not a fresh market-moving signal.

In this episode of NewsBTC’s daily technical analysis videos, we examine major Bitcoin price troughs with Hurst Cycle Theory and cyclical tools to consider if the bottom could be in and if another bubble is coming.
Take a look at the video below:
VIDEO: Bitcoin Price Analysis (BTCUSD): November 7, 2022In this video, we use Hurst Cycle Theory and its several key principles to go through the process of phasing out Bitcoin market cycles to predict when the cryptocurrency will begin to rise again. Cycle analysis consists of visual analysis, using a spectrogram, phasing the dominant cycle, phasing any internal wave harmonics, then completing the phasing process on the chart. Here is a closer look at that process:
Bitcoin Cyclical Behavior AnalyzedTo assist with the visual analysis, each Bitcoin halving has been included. The halving has been a widely-discussed driver of internal supply and demand mechanics. We know that Bitcoin bottoms out visually prior to each halving. The log growth curve has also been included for visual assistance.
The next step is to turn on a spectrogram. A spectrogram is a visual heatmap of the spectrum of frequencies of a signal as it varies with time. The more green heat, the stronger the bullish intensity. In contrast, the more purple heat on the map, the stronger the bearish intensity is and that’s where we would look for a cyclical bottom. Within each purple zone we would find our cyclical trough for dominant cycle phasing.
Is a new Bitcoin cycle about to begin? | Source: BTCUSD on TradingView.comRelated Reading: Litecoin Recovery To End Ongoing Crypto Darkness? LTCUSD November 2, 2022
Why This Bear Market Felt So ExtremeThe next step would be to confirm the dominant cycle by phasing out any harmonics. According to Hurst Cycle Theory, harmonics in cycles come in twos and threes. Essentially, from each major trough to trough, there should be one to two mid-cycle dips.
Not only does defining the mid-cycle harmonics assist in confirming dominant cycle phasing, but it does also help prove Hurst cycle theory to be accurate. Notice that cyclical troughs tend to bottom in tandem, while the principle of summation explains why the recent selloff felt so long and extreme – it was the sum of a larger composite wave and a smaller harmonic wave combined.
Each correction was in near-perfect harmony | Source: BTCUSD on TradingView.comRelated Reading: Bitcoin And The Dollar Reach Inverse Inflection Points | BTCUSD November 1, 2022
Why BTC Is Gearing Up For Another Bubble CycleThe final step is completing the phasing. For added confirmation, the Fisher Transform is used, which helps to pinpoint precise turning points in markets, as well as the Stochastic RSI. In this system, the Fisher Transform highlights the potential turning point, while the Stoch RSI rising from oversold levels confirms the new bull run.
Is this the turning point in the bear market? | Source: BTCUSD on TradingView.com A Comparison With The Last Crypto Market BottomConsidering the potential of a bottom in this area, it is worth examining past bottom behavior. Comparing the current Adam and Eve bottom setup to the 2018 bear market bottom is strikingly similar, albeit on a much grander scale. When compared using the three-day timeframe and a set of three slow, moderate, and fast moving averages, the fractal could take Bitcoin price to around $100,000 per coin by the end of Q1 2023.
Will BTC close 2022 headed towards new highs? | Source: BTCUSD on TradingView.comLearn crypto technical analysis yourself with the NewsBTC Trading Course. Click here to access the free educational program.
Follow @TonySpilotroBTC on Twitter or join the TonyTradesBTC Telegram for exclusive daily market insights and technical analysis education. Please note: Content is educational and should not be considered investment advice.
Featured image from iStockPhoto, Charts from TradingView.coWhy this matters
This bitcoin story adds another data point to the current market tape and is useful when read alongside nearby source coverage.
Original source
Read on NewsBTCRelated market context

Bitwise Dogecoin ETF Reaches Scheduled Liquidation As Holders Face Cash Redemption
TL;DR: Bitwise’s BWOW Dogecoin ETF reached its announced October 22 liquidation distribution date, with remaining shareholders due...

Bitcoin’s midterm slump looks more like its own cycle than election fallout
Bitcoin's cyclical patterns suggest internal market dynamics may outweigh political events, highlighting the asset's unique volati...

Coinbase Ireland Admits Breaches, Takes $3.64 Million Penalty Over Underfunded Customer Account
Coinbase Ireland Limited, the exchange’s Irish e-money unit, has admitted breaching rules meant to protect customer cash and accep...

Keystone Hardware Wallet says website breach exposed customer data
The breach highlights the ongoing vulnerability of customer data in the crypto industry, emphasizing the need for enhanced securit...

Anthropic targets November IPO as Polymarket traders bet on $ANT ticker
Anthropic's IPO could reshape AI investment, offering public access to AI model developers and highlighting valuation risks amid r...
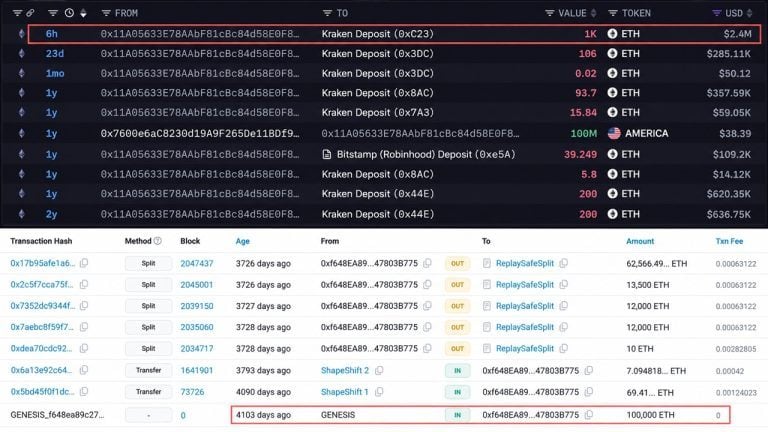
Whale That Bought 100,000 ETH for $0.31 Each Just Sent $2.4M to Kraken
An Ethereum initial coin offering (ICO) buyer who bought 100,000 ETH at $0.31 each just moved another 1,000 ETH, worth about $2.4...