Bitcoin Price Clears $17K, Why Dips Turn Attractive In Short-Term
Bitcoin price was able to clear the $17,000 resistance. BTC is consolidating gains and might remain supported above the $16,750 level. Bitcoin gained pace and cleared the $16,800 and $17,000 resistance levels. The price...
Archive context
Older archive item. Useful for background and entity history, but not a fresh market-moving signal.

Bitcoin price was able to clear the $17,000 resistance. BTC is consolidating gains and might remain supported above the $16,750 level.
- Bitcoin gained pace and cleared the $16,800 and $17,000 resistance levels.
- The price is trading above $16,800 and the 100 hourly simple moving average.
- There is a key bullish trend line forming with support near $16,950 on the hourly chart of the BTC/USD pair (data feed from Kraken).
- The pair could rise further if it stays above the $16,500 support zone.
Bitcoin price remained well bid above the $16,500 support zone. BTC gained pace and was able to clear the $16,800 resistance zone plus the 100 hourly simple moving average.
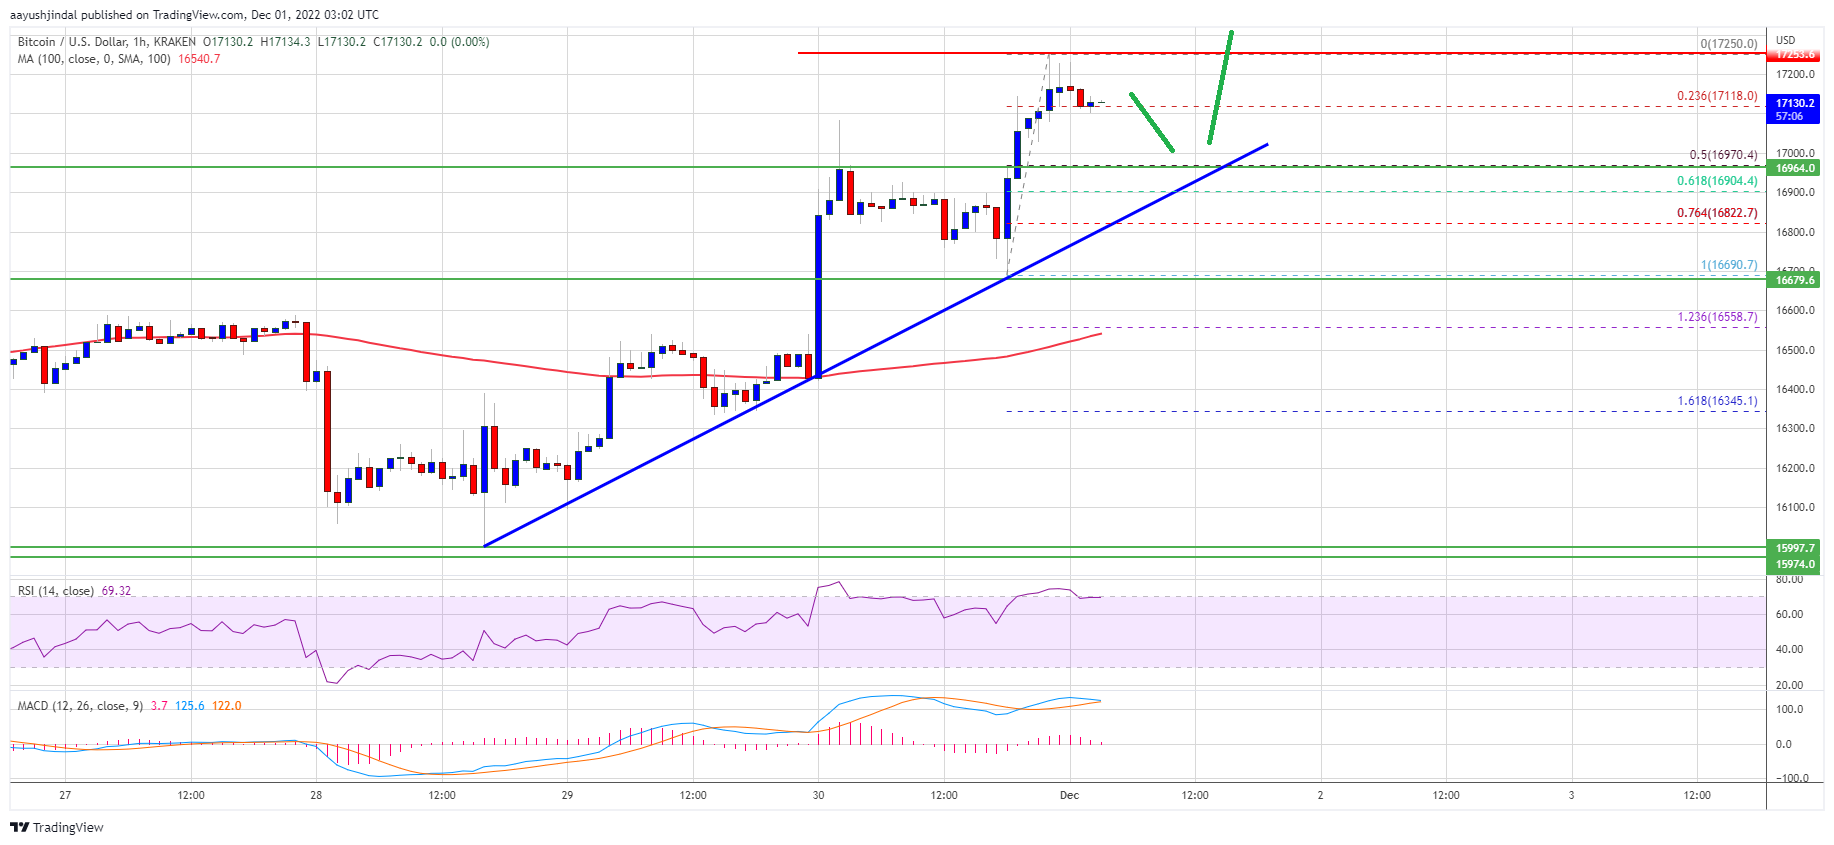
The upward move was such that the price even surpassed the $17,000 resistance zone. It traded as high as $17,250 before the bulls faced sellers. It is now consolidating gains above the $17,000 level. The price is trading near the 23.6% Fib retracement level of the upward move from the $16,690 swing low to $17,250 high.
Bitcoin price is now trading above $16,800 and the 100 hourly simple moving average. There is also a key bullish trend line forming with support near $16,950 on the hourly chart of the BTC/USD pair.
On the upside, an immediate resistance is near the $17,950 level. The first major resistance is near the $17,500 zone, above which the price may perhaps start another steady increase. In the stated case, the price could rise towards the $18,000 resistance.
Source: BTCUSD on TradingView.com
The next major resistance is near $18,800, above which the price could gain pace for a move towards the $19,500 zone in the near term.
Dips Limited in BTC?If bitcoin fails to climb above the $17,250 resistance, there could be a downside correction. An immediate support on the downside is near the $17,000 level. The next major support is near the $16,950 zone and the trend line.
The trend line is close to the 50% Fib retracement level of the upward move from the $16,690 swing low to $17,250 high. A downside break below the trend line might call for a move towards $16,800. Any more losses might call for a test of the key $16,500 support zone in the near term.
Technical indicators:
Hourly MACD – The MACD is now losing pace in the bullish zone.
Hourly RSI (Relative Strength Index) – The RSI for BTC/USD is now above the 50 level.
Major Support Levels – $16,950, followed by $16,800.
Major Resistance Levels – $17,250, $17,500 and $18,000.
Why this matters
This bitcoin story adds another data point to the current market tape and is useful when read alongside nearby source coverage.
Original source
Read on NewsBTCRelated market context

XRP Price Prediction: Key Metrics Point to a Crash
XRP prediction chatter is heating up even as the price slips, which is usually when markets like to play tricks. XRP trades at aro...

Ethereum Research Thread Puts Sybil Resistance Back In Focus For Decentralized Networks
Ethereum Research Thread Puts Sybil Resistance Back In Focus For Decentralized Networks is a useful reminder that crypto coverage...

XRP’s $1 rebound faces holders trapped above $2
Glassnode reported that XRP holders who bought between 6 and 12 months ago have an average cost basis near $2.22, roughly 52% abov...

Ripple Crowned: UK Treasury Just Changed Everything for XRP
In the latest XRP news, Ripple Labs has joined the UK HM Treasury’s Wholesale Digital Markets taskforce, a 54-firm initiative that...

Bitcoin pushes toward $65,000 on US inflation relief that may already be fading
Bitcoin approached $65,000 on July 14 as a sharper-than-expected slowdown in US inflation weakened the case for another near-term...

Chainalysis Adds Automatic Stablecoin Support As Compliance Teams Face Token Sprawl
Chainalysis Adds Automatic Stablecoin Support As Compliance Teams Face Token Sprawl is a useful reminder that crypto coverage is n...