Bitcoin Price Close Above 100 SMA Could Spark A Fresh Surge: Here’s Why
Bitcoin price started a downside correction below $20,500 against the US Dollar. BTC could start a fresh surge if it clears the 100 hourly SMA and then $21,000. Bitcoin is recovering losses from the $20,250 support zone....
Archive context
Older archive item. Useful for background and entity history, but not a fresh market-moving signal.

Bitcoin price started a downside correction below $20,500 against the US Dollar. BTC could start a fresh surge if it clears the 100 hourly SMA and then $21,000.
- Bitcoin is recovering losses from the $20,250 support zone.
- The price is trading below $20,700 and the 100 hourly simple moving average.
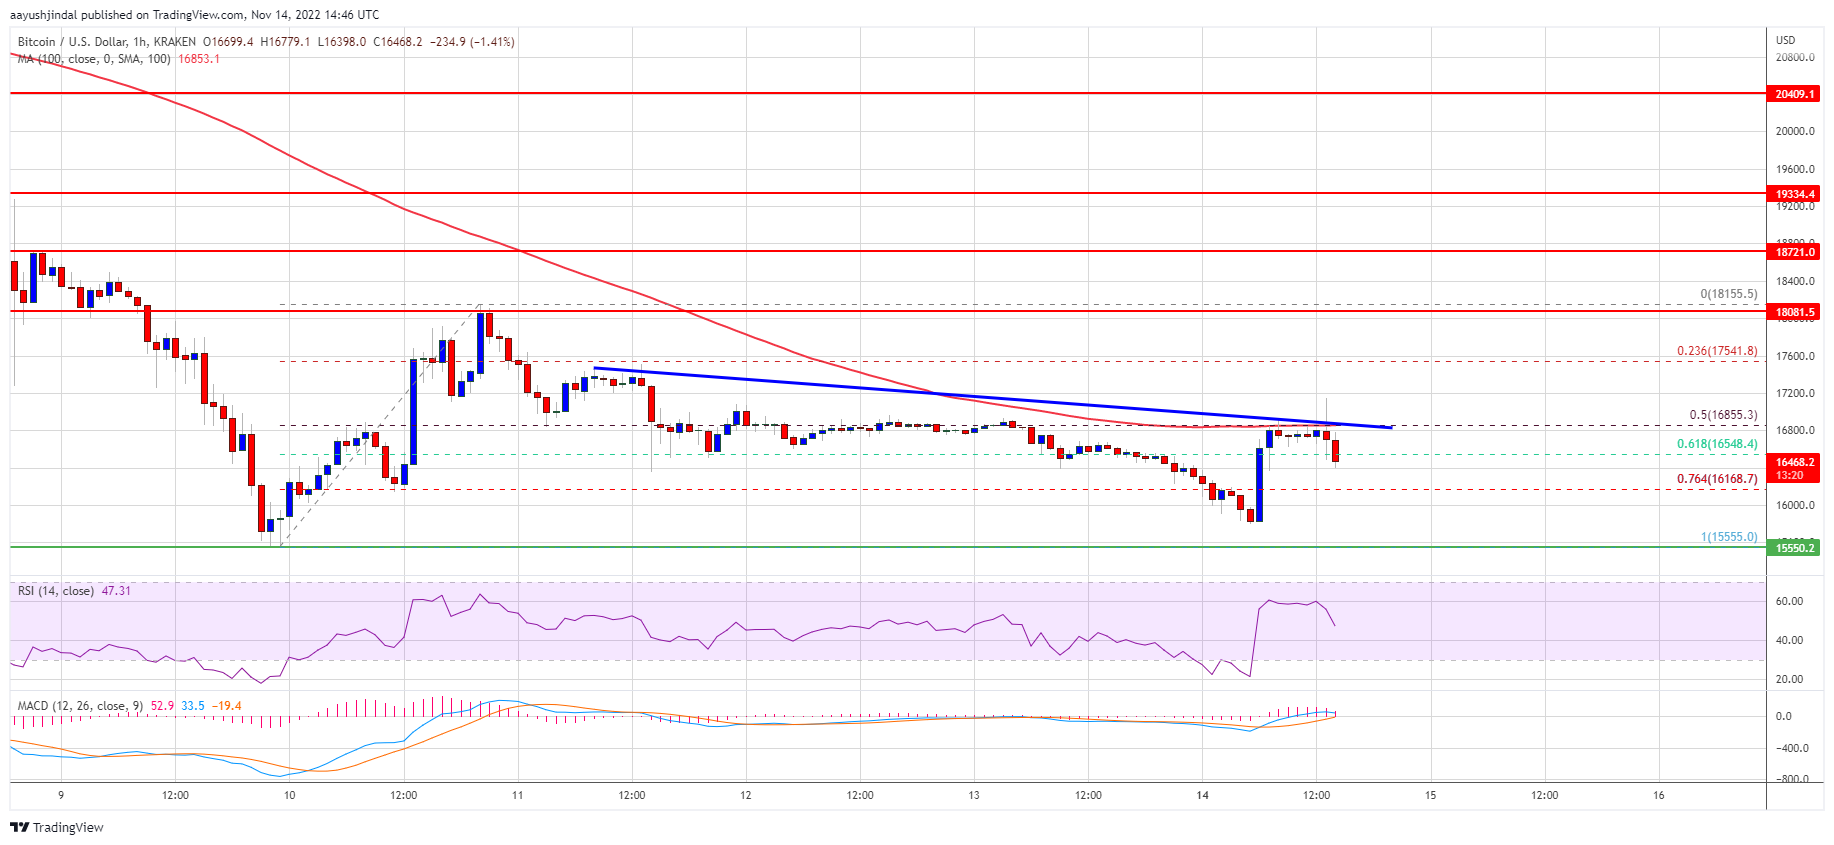
- There is a major bearish trend line forming with resistance near $20,680 on the hourly chart of the BTC/USD pair (data feed from Kraken).
- The pair could start another upward move if it clears the 100 hourly SMA and then $21,000.
Bitcoin price started a downside correction after it failed to surpass the $21,000 resistance zone. BTC corrected lower below the $20,600 and $20,500 levels.
The decline gained pace below the $20,500 level and the 100 hourly simple moving average. However, the bulls were active near the $20,250 level. A low was formed near $20,250 and the price started a steady upward move. There was a wave above the $20,400 and $20,500 levels.
Bitcoin price climbed above the 23.6% Fib retracement level of the downward move from the $21,074 swing high to $20,250 low. On the upside, an immediate resistance is near the $20,600 zone and the 100 hourly simple moving average.
The first major resistance sits near the $20,700 level. There is also a major bearish trend line forming with resistance near $20,680 on the hourly chart of the BTC/USD pair. The trend line is near the 50% Fib retracement level of the downward move from the $21,074 swing high to $20,250 low.
Source: BTCUSD on TradingView.com
The next major resistance is still near $21,000. A clear move above the $21,000 resistance might start a fresh surge. In the stated case, the price may perhaps rise towards the $22,500 resistance zone.
More Downsides in BTC?If bitcoin fails to clear above the $20,700 resistance zone, it could start another downward move. An immediate support on the downside is near the $20,400 zone.
The next major support is near the $20,250 zone. The main support sits at $20,000, below which there is a risk of a larger decline. In this case, the price may perhaps decline towards the $19,200 level.
Technical indicators:
Hourly MACD – The MACD is now gaining pace in the bullish zone.
Hourly RSI (Relative Strength Index) – The RSI for BTC/USD is now above the 50 level.
Major Support Levels – $20,400, followed by $20,250.
Major Resistance Levels – $20,600, $20,700 and $21,000.
Why this matters
This bitcoin story adds another data point to the current market tape and is useful when read alongside nearby source coverage.
Original source
Read on NewsBTCRelated market context

XRP’s $1 rebound faces holders trapped above $2
Glassnode reported that XRP holders who bought between 6 and 12 months ago have an average cost basis near $2.22, roughly 52% abov...

Ethereum Research Thread Puts Sybil Resistance Back In Focus For Decentralized Networks
Ethereum Research Thread Puts Sybil Resistance Back In Focus For Decentralized Networks is a useful reminder that crypto coverage...

Bitcoin Price Prediction: Strategy Has a New BTC Approach
Bitcoin price is trading at $62,900, as we debate whether this pause is simply a reset or something more serious, with bearish pre...

XRP Price Prediction: Key Metrics Point to a Crash
XRP prediction chatter is heating up even as the price slips, which is usually when markets like to play tricks. XRP trades at aro...

SharpLink generates 499 Ethereum from staking rewards this week, total holdings near 888K ETH
SharpLink's strategic ETH accumulation and staking rewards enhance its market position, offering investors indirect Ethereum expos...

Bitcoin pushes toward $65,000 on US inflation relief that may already be fading
Bitcoin approached $65,000 on July 14 as a sharper-than-expected slowdown in US inflation weakened the case for another near-term...