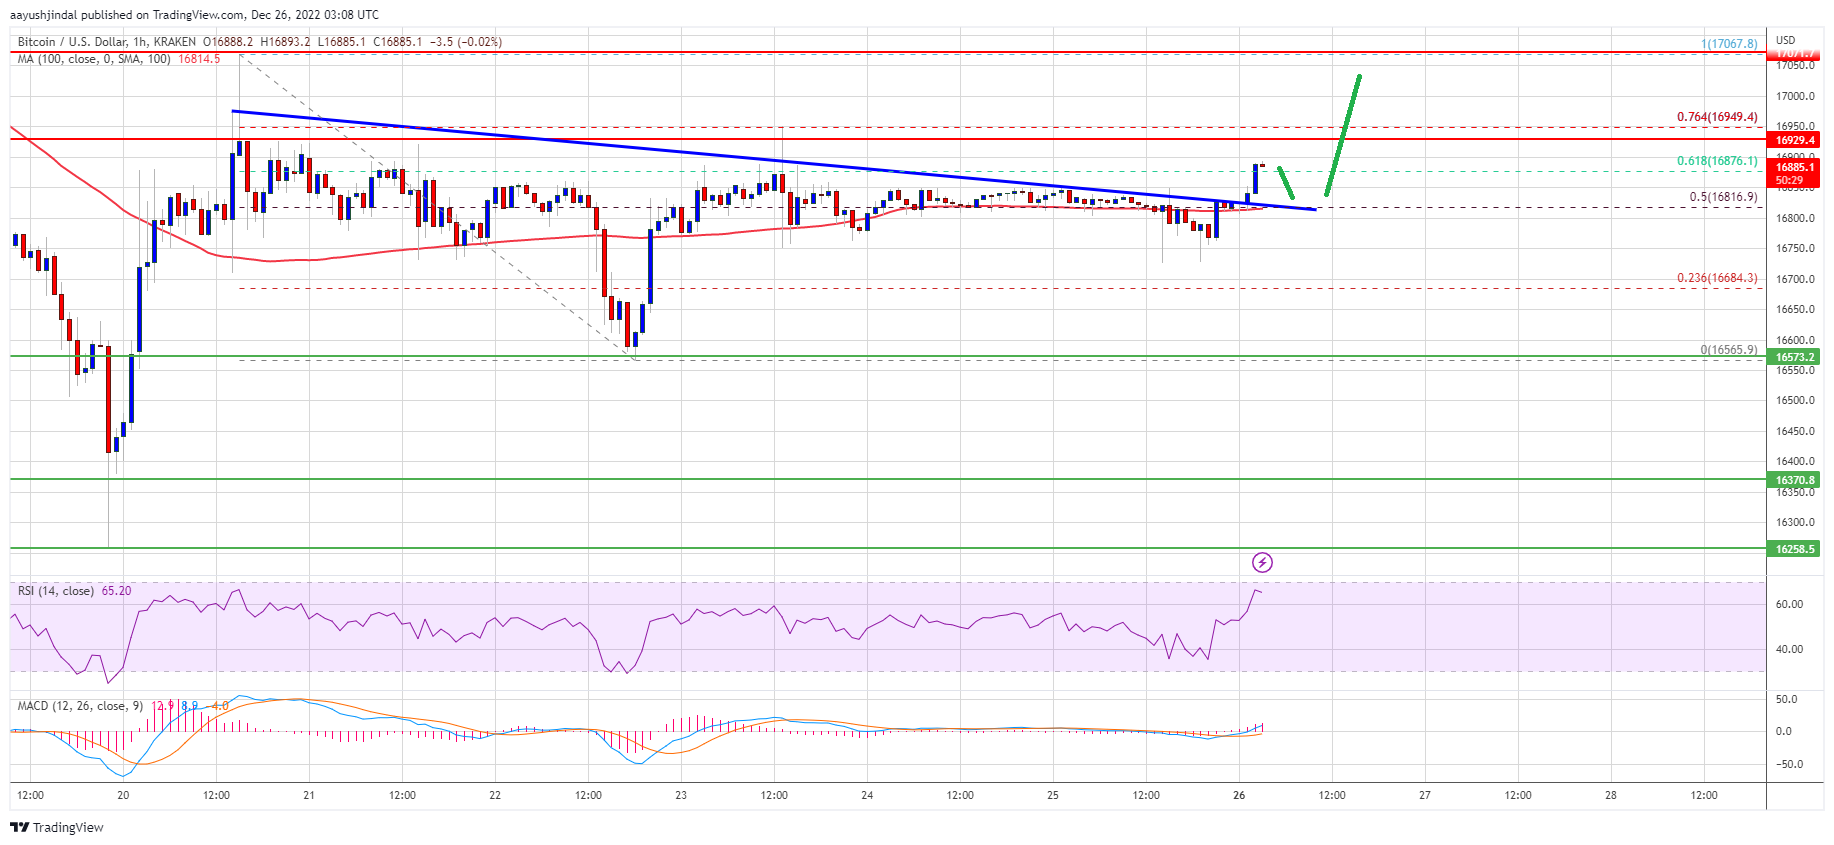
Bitcoin Price Close Above $17.5K Could Spark Larger Degree Recovery
Bitcoin price is attempting an upside break above $17,000. BTC could start a steady recovery if it clears the $17,000 and $17,200 resistance levels. Bitcoin is attempting an upside break above the $17,000 and $17,200 lev...
Archive context
Older archive item. Useful for background and entity history, but not a fresh market-moving signal.

Bitcoin price is attempting an upside break above $17,000. BTC could start a steady recovery if it clears the $17,000 and $17,200 resistance levels.
- Bitcoin is attempting an upside break above the $17,000 and $17,200 levels.
- The price is trading above $16,800 and the 100 hourly simple moving average.
- There was a break above a key bearish trend line with resistance near $16,820 on the hourly chart of the BTC/USD pair (data feed from Kraken).
- The pair could attempt a fresh increase if there is a clear move above the $17,200 resistance zone.
Bitcoin price managed to stay above the $16,550 zone. A base was formed and the price started a fresh increase above the $16,700 resistance zone. BTC even climbed above the $16,800 resistance and the 100 hourly simple moving average.
There was a clear move above the 50% Fib retracement level of the downward move from the $17,067 swing high to $16,565 low. Besides, there was a break above a key bearish trend line with resistance near $16,820 on the hourly chart of the BTC/USD pair.
Bitcoin price is now trading above $16,800 and the 100 hourly simple moving average. It is also trading above the 61.8% Fib retracement level of the downward move from the $17,067 swing high to $16,565 low.
On the upside, an immediate resistance is near the $17,000 zone. The first major resistance is near the $17,200 zone. A clear move above the $17,200 resistance might start a steady recovery wave.
Source: BTCUSD on TradingView.com
The next major resistance is near $17,500, above which the price climb towards the $18,000 resistance zone. Any more gains might send the pair towards the $18,500 resistance zone.
Fresh Drop in BTC?If bitcoin fails to clear the $17,200 resistance, there could be a fresh downward move. An immediate support on the downside is near the $16,800 level and the 100 hourly SMA
The next major support is near the $16,680 level. A downside break below the $16,680 support might call for a move towards the $16,550 level. Any more losses might send the price towards $16,350.
Technical indicators:
Hourly MACD – The MACD is now gaining pace in the bullish zone.
Hourly RSI (Relative Strength Index) – The RSI for BTC/USD is now above the 50 level.
Major Support Levels – $16,800, followed by $16,550.
Major Resistance Levels – $17,000, $17,200 and $17,500.
Why this matters
This bitcoin story adds another data point to the current market tape and is useful when read alongside nearby source coverage.
Original source
Read on NewsBTCRelated market context

Ethereum Price Prediction: Robinhood Chain Leads Ethereum’s Biggest User Onboarding Wave
Price prediction debates are heating up as Ethereum trades at $1,790 and is slipping in trading volume. Still, Robinhood Chain kee...

Ethereum (ETH) Price Prediction: ETH Eyes $2,100 as ETF Inflows Return and Whale Demand Builds
Ethereum price is trading near $1,785 after a modest 24-hour recovery, but the market is now watching whether fresh inflows and wh...

XRP’s $1 rebound faces holders trapped above $2
Glassnode reported that XRP holders who bought between 6 and 12 months ago have an average cost basis near $2.22, roughly 52% abov...

XRP Price Prediction: Key Metrics Point to a Crash
XRP prediction chatter is heating up even as the price slips, which is usually when markets like to play tricks. XRP trades at aro...

Bitcoin Price Prediction: Strategy Has a New BTC Approach
Bitcoin price is trading at $62,900, as we debate whether this pause is simply a reset or something more serious, with bearish pre...

Google Gemini AI Predicts Shocking Bitcoin Price by End of 2026
Google Gemini AI just framed Bitcoin current price position as a coiled spring rather than a broken asset. The model predicts $120...